Introduction
This article is a brief overview on how we can integrate JavaScript charting frameworks with EXTJS.
There are various open source JavaScript charting frameworks available. In this article we will cover how to integrate AmChart with EXTJS, AmCharts is an JavaScript charting library which provides different data visualisation.
Let us try to implement AmChart in EXTJS.
Pre-Requisites
- AmCharts amcharts library.
- Sencha Ext-JS development environment(Sencha cmd , ExtJS SDK etc).
- Sample ExtJS application.
- Working knowledge of Sencha ExtJS.
Getting Started
Following are the quick steps:
Step 1 : Create EXT JS Application.
Create an ExtJS app, To create ExtJS app follow the link given below.
Creating new ExtJS app
Step 2 : Download AmChart Library.
Download the AmChart library from the following url and extract the contents of the archive to a directory of your choice.
https://www.amcharts.com/download/
Step 3 : Adding AmChart library files in our application.
Create a folder name like “lib” in our application
Copy “amcharts” directory from downloaded zip file into your “lib” folder and open the amcharts folder to see the list of files.
The amcharts folder contains the following files.
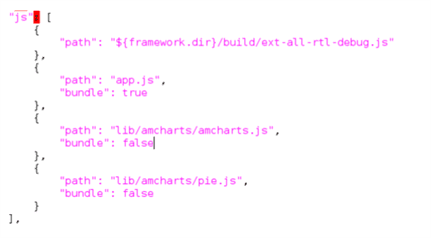
Open the app.json file to include the require amcharts library files path into the file.
After including the path it looks like this.
Step 4 : Defining Chart Store Class.
Define new class in your application and extend the class with “Ext.data.Store”.
Follow the following code –
1 2 3 4 5 6 7 8 9 10 11 12 13 14 15 16 17 18 19 20 21 22 23 24 25 26 27 28 29 30 31 |
Ext.define('App.ChartStore', { extend: 'Ext.data.Store', fields: ['categoryName', 'categoryVal', 'sliceColor'], data: [ { "customerName": "United States", "amount": "10000", "sliceColor": "#02105F" }, { "customerName": "India", "amount": "1000", "sliceColor": "#B02A30" }, { "customerName": "China", "amount": "10000", "sliceColor": "#C36700" }, { "customerName": "Brazil", "amount": "10900", "sliceColor": "#7585E3" }, { "customerName": "Qatar", "amount": "10000", "sliceColor": "#D1CECE" }, { "customerName": "United Kingdom", "amount": "30000", "sliceColor": "#F78200" } ] }); |
Step 5 : Defining Chart Class.
Define a new class in your application and extend it with “Ext.container.Container”, while giving the alias name as piechart.
Follow the following code –
1 2 3 4 5 6 7 8 9 10 11 12 13 14 15 16 17 18 19 20 21 22 23 24 25 26 27 28 29 30 31 32 33 34 35 36 37 38 39 40 41 42 43 44 45 46 47 48 49 50 51 52 53 54 55 56 57 58 59 60 61 62 63 64 65 66 67 68 |
Ext.define("App.AmPieChart", { extend: "Ext.container.Container", alias: "widget.piechart", layout: 'fit', cls: 'spendAnalysisDonutChart-cls', initComponent: function () { Ext.apply(this, { html: '<div id=' + this.chartId + ' style="width:' + this.width + 'px; height:' + this.height + 'px;"><div>' }); var st = Ext.getStore(this.store); st.on('load', this.refreshData, this); this.callParent(arguments); }, refreshData: function () { if (!this.chart) this.setup(); this.update(); }, onRender: function () { this.callParent(arguments); if (!this.chart) this.setup(); this.update(); this.chart.write(this.chartId); }, setup: function () { if (this.chart) return; this.chart = new AmCharts.AmPieChart(); var legend = new AmCharts.AmLegend(); this.chart.titleField = 'customerName'; this.chart.valueField = 'amount'; this.chart.radius = '30%'; this.chart.colorField = 'sliceColor'; this.chart.balloonText = "[[title]]<br><span style='font-size:14px'><b>Loan Amount:[[value]]</b></span>"; this.chart.startDuration = 0; this.chart.labelRadius = 20; this.chart.innerRadius = '50%'; legend.position = this.position; legend.markerType = "circle"; legend.markerLabelGap = 10; legend.markerSize = 10; legend.maxColumns = 1; legend.valueWidth = this.valueWidth; legend.fontSize = 15; legend.color = "#454545" this.chart.addLegend(legend); }, update: function () { var asset = Ext.getStore(this.store), data = [], obj; for (obj in asset.data.items) { data.push(asset.data.items[obj].data); } this.chart.dataProvider = data; this.chart.validateData(); } }); |
Step 6 : Using Chart as xtype.
To use the PieChart in your application, create a panel and add PieChart in panel items.
Follow the following code –
1 2 3 4 5 6 7 8 9 10 11 12 13 14 15 |
Ext.create('Ext.panel.Panel', { title: 'AmChart In EXTJS', titleAlign: 'center', renderTo: Ext.getBody(), items: [ { xtype: 'piechart', store: 'App.ChartStore', chartId: 'pieChartId', width: 700, height: 500, position: 'right' } ] }); |
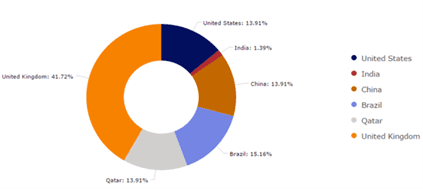
Save and run your application in browser, following is the output how it looks like –
You may try it on Sencha Fiddle
Summary
In this article we learnt “how to integrate AmChart with EXTJS and use as xtype” by adding the AmChart library. Hope you found this helpful.
References
- Ext JS Docs
- AmChart
