

Blogs
D3 Data visualizations in Ext JS 6.2
Introduction
D3.js is a JavaScript library for manipulating documents based on data. D3 helps you bring data to life using HTML, SVG, and CSS. D3’s emphasis on web standards gives you full capability of modern browsers, without tying yourself to a proprietary framework, combining powerful visualisation components and a data-driven approach to DOM manipulation.
D3 helps us to build diagrams/charts, which can be data driven and transformed by data. Besides, it is an Open Source library.
Ext JS 6.2.0 introduced D3 Adaptor for Ext JS. It gives a great flexibility to build D3 components in Ext JS, easily.
In this article we will build D3 diagram in Ext JS with the help of D3 Adapter/add-on.
Ext JS D3 API Overview
D3 has been added as a package to Ext JS 6.2.0. D3 Component is an abstract class, which has D3 SVG and Canvas implementations. We have to use chose between SVG and Canvas APIs to draw D3 diagram as each one has its own specific implementation unlike Ext JS Draw package. The below screenshot shows the d3 package structure:
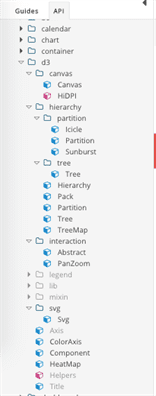
Along with SVG and Canvas, the D3 package has got HeatMap Component, Partition, Pack, Tree, TreeMap layout’s and PanZoom interaction.
Create Ext JS 6.2.0 Application with D3 Adapter
- Request for Ext JS 6.2.0 EA. Fill the form and you shall receive an email with the link to download Ext JS 6.2.0 EA, Sencha Cmd 6.2.0 and Add-on’s ( Calendar,Pivot,D3 Adapter )
- Download Ext JS 6.2.0 EA, Sencha Cmd 6.2.0, and D3 Adaptor
- Generate app with Ext JS 6.2.0 and Cmd 6.2.0
- Copy the D3 Adaptor package from add-ons to your project packages/local folder
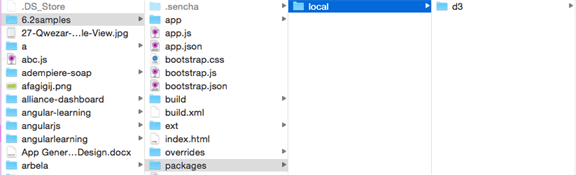
- Add D3 as required in your project app.json file
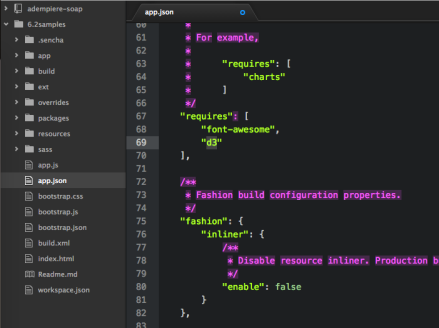
- Run sencha app refresh to load the app.json changes to the application i.e load D3 package classes into the Application.

SVG Example
Now that our project is setup for D3 development, let us try to build circles with the radius from the data forming a circle, using the SVG API.
Add d3-svg xtype as item to component. This component fires scenesetup event as soon as the SVG document is created. Inside the event handler we will draw circles, as shown below:
xtype:'d3-svg',
 listeners:{
 scenesetup:function(comp,scene){

var data = [1, 2, 3, 4, 5, 6, 7, 8, 9, 10],
 colors = d3.scale.category20(),
 twoPi = 2 * Math.PI,
 gap = twoPi / data.length,
 r = 100;

scene.append('g')
 .attr('transform', 'translate(150,150)')
 .selectAll('circle')
 .data(data)
 .enter()
 .append('circle')
 .attr('fill', function (d) {
 return colors(d);
 })
 .attr('stroke', 'black')
 .attr('stroke-width', 3)
 .attr('r', function (d) {
 return d * 3;
 })
 .attr('cx', function (d, i) {
 return r * Math.cos(gap * i);
 })
 .attr('cy', function (d, i) {
 return r * Math.sin(gap * i);
 }).attr('rx', function (d, i) {
 return r * Math.cos(gap * i)-d;
 })
 .attr('ry', function (d, i) {
 return r * Math.sin(gap * i)-d;
 });

}
 }
scenesetup handler has two arguments – (1)comp that refers to D3Component instance and (2)scene that refers to the g element added to the svg document, which will be the parent element for the diagram that we going to draw.
Save and run the example in a browser and you shall see the following output:
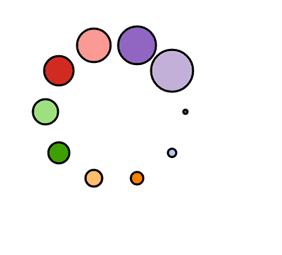
You can find the above example in D3-Svg documentation of Ext JS 6.2.0 here
Canvas Example
Let us try to draw bars on the canvas with different colours using the Canvas API.
Add d3-canvas xtype as item to component. This component fires sceneresize event as soon as the canvas is created and size of the canvas is set for the specific d3 component. Inside the event handler, we can add bars to the canvas, as shown below:
xtype: 'd3-canvas',
 listeners:{
 sceneresize: function (component, canvas, size) {
 var barCount = 10,
 barWidth = size.width / barCount,
 barHeight = size.height,
 context = canvas.getContext('2d'),
 colors = d3.scale.category20(),
 i = 0;

for (; i < barCount; i++) {
 context.fillStyle = colors(i);
 context.fillRect(i * barWidth, 0, barWidth, barHeight);
 }
 }
 }
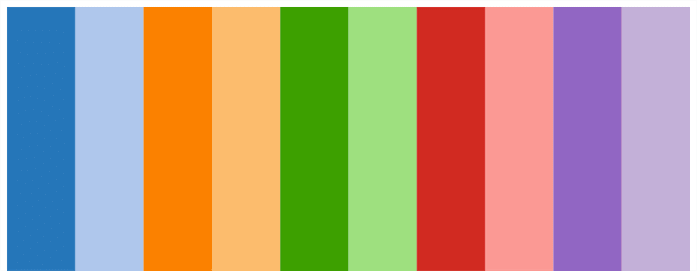
You can find the above example in D3-Canvas documentation of Ext JS 6.2.0 here . In documentation Fiddle sample in listeners you find handler for canvasresize change it to sceneresize
Summary
In this Article we have seen how to setup Ext JS 6.2.0 EA Project setup with D3 add-on and draw diagram with D3 SVG and D3 Canvas APIs in Ext JS.
You may download the samples code from GitHub and give it a try. Do let me know how did it go.
Reference
- D3.js
- Ext JS D3 Canvas API
- Ext JS D3 SVG API