

Blogs
D3 Layouts in Ext JS


Problem Statement
When I was trying to build drawings with D3 add-on in ExtJS, I could not find sufficient documentation in a single place, which I can refer and complete my work. In this article, I have tried to document most of the API usage with examples. I hope this helps you in using D3 add-on in ExtJS with ease.
As of now, I am covering following topics and I will keep extending this as and when I come across something new:
- D3 Layouts Hierarchy in Ext JS 6.2
- Features of Hierarchy
- Implementing TreeMap in Ext JS 6.2
- TreeMap Implementation
- Implement switch between Count and Size
- Showing Tooltip on each node with the Node Text
- Implementing colorAxis for TreeMap
- Implementing Different Color for Parent Nodes
- Handling select and deselect events
Introduction
D3 library has got twelve layouts as of now. These layouts encapsulate the strategy and logic for laying out the elements and visually representing the data. Layouts apply an algorithm on the data and produce or arrange the elements in the desired manner.
Layouts in D3
- Bundle – apply Holten’s hierarchical bundling algorithm to edges.
- Chord – produce a chord diagram from a matrix of relationships.
- Cluster – cluster entities into a dendrogram.
- Force – position linked nodes using physical simulation.
- Hierarchy – derive a custom hierarchical layout implementation.
- Histogram – compute the distribution of data using quantized bins.
- Pack – produce a hierarchical layout using recursive circle-packing.
- Partition – recursively partition a node tree into a sunburst or icicle.
- Pie – compute the start and end angles for arcs in a pie or donut chart.
- Stack – compute the baseline for each series in a stacked bar or area chart.
- Tree – position a tree of nodes tidily.
- TreeMap – use recursive spatial subdivision to display a tree of nodes.
In this article will discuss how layouts of D3 are implemented in Ext JS 6.2 and their structure. Will try to implement TreeMap and Tree layouts.
D3 Layouts Structure in Ext JS 6.2
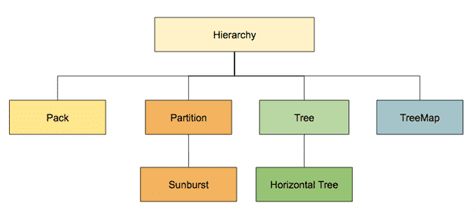
Hierarchy is an Abstract Layout class of D3 Hierarchy layouts. Hierarchy layouts are
- Pack – hierarchical layout using recursive circle-packing.
- Partition – recursively partition a node tree into a sunburst or icicle.
- Tree – position a tree of nodes tidily
- TreeMap – use recursive spatial subdivision to display a tree of nodes
Features of Hierarchy
- Data aware component can bind store to the component and supports Tree Data
- nodeValue can be a count or size, which will be equal to all the nodes or a function, which can define size of a node in the document or a map
- ToolTip config can show the configured tooltip on mousemove event of the node
- colorAxis allows us to map the Colors to the data. It supports all the scales available in D3.
- NodeSelect and NodeDeSelect events – Implementation classes have their own implementations for nodeselect and nodedelselect events.
- nodeText allows configuring the field to be displayed in the hierarchy from the data.
In this article, we will make use of TreeMap to demonstrate all the features listed above. You can very well use the concept explained for TreeMap example for other layouts (Pack, Partition and Tree) as well.
Using TreeMap in Ext JS 6.2
Create an Ext JS 6.2 application following the steps in D3 Data visualizations in Ext JS 6.2. After this you shall have an application consisting of D3 Add-on with sample D3 drawing.
1. TreeMap Implementation
Let us implement the TreeMap example here in D3.
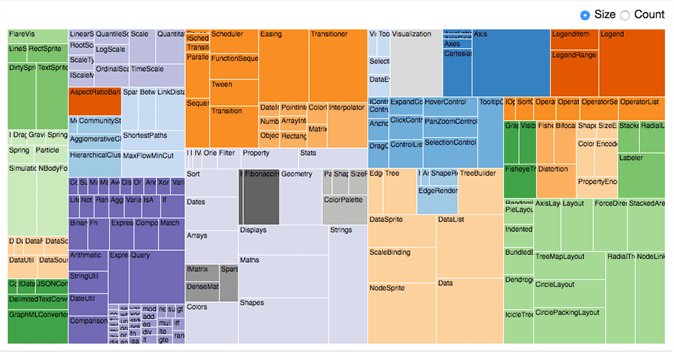
I have taken the flare.json used in the sample here, to use in my example. The size of the Node in the TreeMap changes on the selection of Size and Count radio buttons.
Let us implement the same example in Ext JS 6.2 and implement all the available features in Hierarchy.
We have TreeMap component in ExtJS 6.2, which we can be used directly to create a TreeMap.
Define a store
Define a store in viewModel to load the flare.json. Let us copy the following code from the D3 TreeMap example:
treemap:{
 type:'tree',
 autoLoad:true,
 proxy:{
   type:'ajax',
   url:'./resources/data/treemap.json'
 }
}
Create TreeMap applying the store defined as below
    xtype:'d3-treemap',
    bind:{
     store:'{treemap}'
    },
    rootVisible: true,
    nodeValue:function(node){
       return node.data.size;
    }
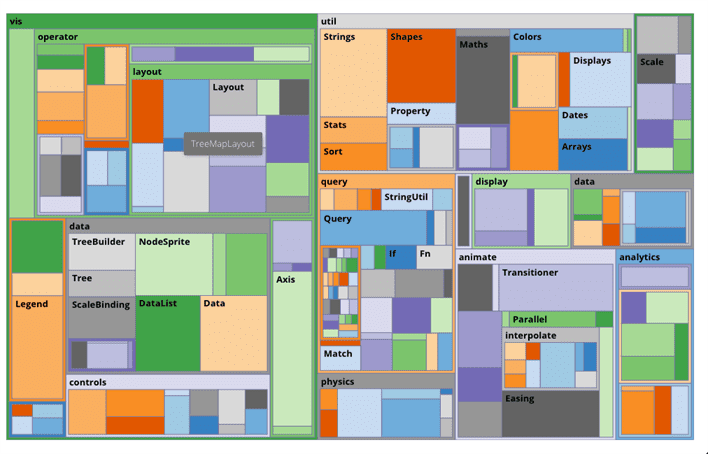
Run Code:
Save and run the example in a browser and you shall see the following output:
By default, TreeMap uses count value, which provides equal size for all the sibling nodes.
2. Using Count and Size feature of Hierarchy
nodeValue of TreeMap is by default the “count”. And by default, all the nodes will occupy the same amount of space. However, if we need to allocate different space for different nodes then we shall set the value of nodeValue to “size”. We need to define a function, which will return the size of a given node.
Let’s add Size and Count buttons and logic to use size field in the node to decide the size of the particular node or count to have equal size for all the sibling nodes
dockedItems:[
    {
        xtype:'segmentedbutton',
        dock:'top',
        items:[
            {
                text:"Size"
            },{
                text:"Count",
                pressed:true
            }
        ],
        listeners:{
            toggle:'onToggleSize'
        }
    }
]
Add the handler in the controller with the name onToggleSize. If the pressed button is the count button then setNodeValue to count else we have provided a function, which will return the size of a particular node. Write a getSize function, which returns the value of the size field in the node as shown below:
onToggleSize: function (segmentedButton, button, pressed) {
    var treemap = this.lookupReference('treemap'),
        value = button.text;
    treemap.setNodeValue(value === "Count" ? 'count' : this.getSize);
},
getSize:function(node){
    return node.get('size');
}
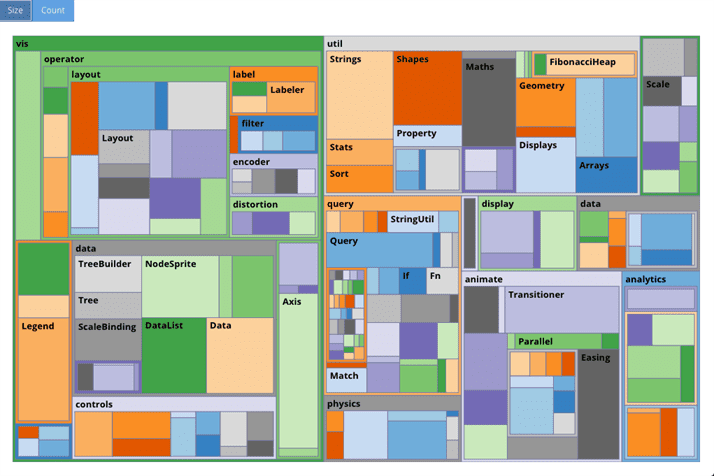
Run Code
Save and run the example in a browser and you shall see the following output:
Click on the Size button, which should get the size from the node and change nodes in the TreeMap, as shown below:
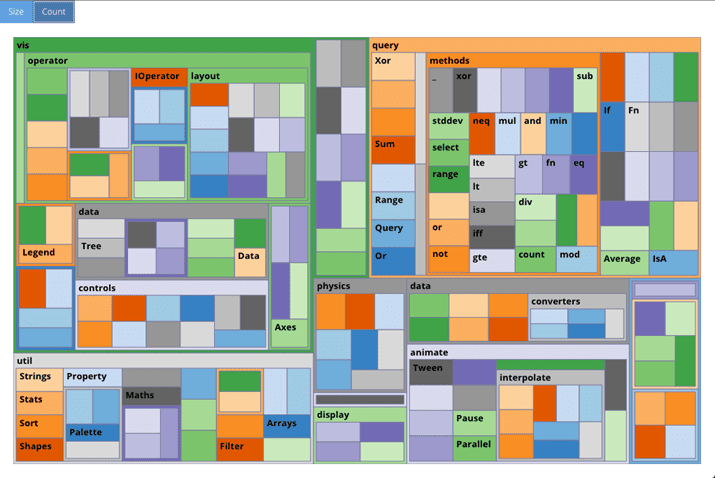
3. Showing Tooltip on each node with the Node Text
Hierarchy class calls a renderer of the tooltip object, provided as the config to the layout when the mouse moves on a Node. So, let us add tooltip object along with renderer, as shown below, to the TreeMap:
tooltip:{
    renderer:function(tooltip,node,element){
        tooltip.setHtml( node.data.name);
    }
}
Run Code
Save and run the example in a browser and you shall see the following output:
4. Implementing colorAxis for TreeMap
D3 supports Scale(s) which is a convenient way to map the data to the visual representation.
It has following scales as of now
- Continuous: Continuous scales map a continuous, quantitative input domain to a continuous output range. A continuous scale is not used directly. Instead, we use linear, power, log, identity, time or sequential color scale.
- Sequential: Sequential scales are similar to continuous scales in that they map a continuous, numeric input domain to a continuous output range
- Quantize : Quantize scales are similar to linear scales, except they use a discrete rather than continuous range
- Quantile: Quantile scales map a sampled input domain to a discrete range.
- Threshold: Threshold scales are similar to quantize scales, except they allow you to map arbitrary subsets of the domain to discrete values in the range
- Ordinal: Unlike continuous scales, ordinal scales have a discrete domain and range. For example, an ordinal scale might map a set of named categories to a set of colors, or determine the horizontal positions of columns in a column chart
You may find more information about D3 Scale here. Ext JS D3 Adaptor supports most of them. In this article, we will make use of the linear scale of Continuous:
colorAxis:{
    scale:{
        type:'linear',
            range:['#FFC300','#571845']
    },
    minimum:0,
        maximum:16540,
        field: 'size'
}
In colorAxis object, you can see that scale type has been configured as linear and range of the color [“#FF300” to “#571845” ], and minimum & maximum values set to 0 & 16540, respectively.
This allows TreeMap to pick up the color for the node between the min and max configured respective nodeValue in the record.
Run Code
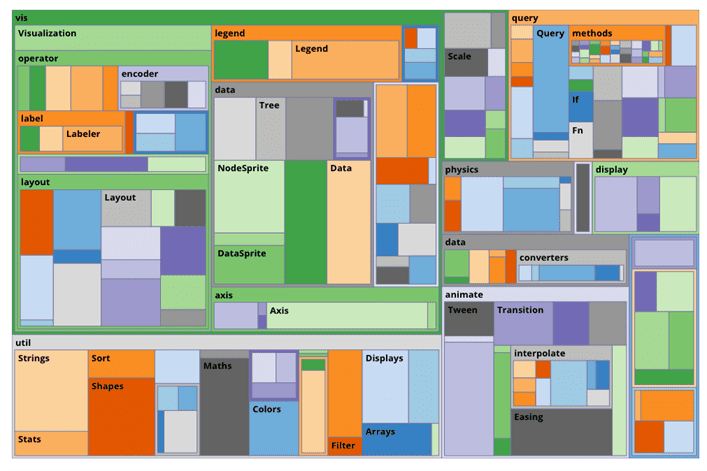
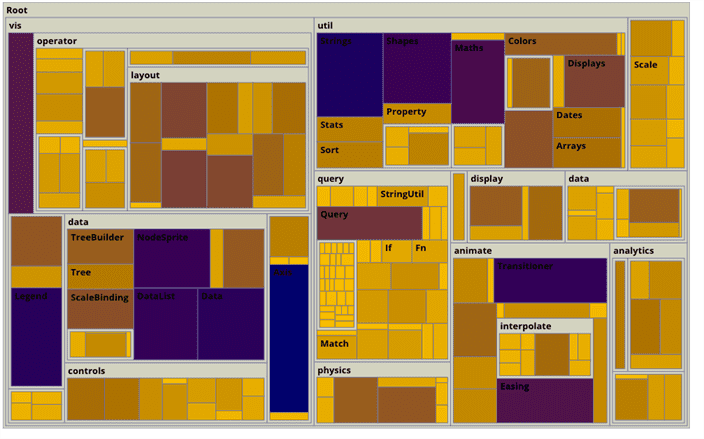
Save and run the example in a browser and you shall see the following output:
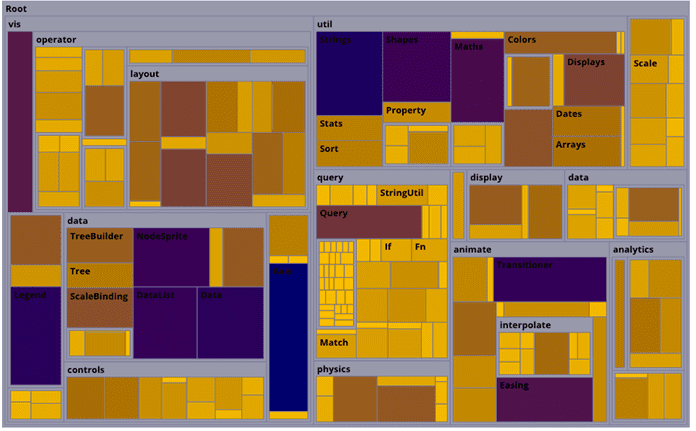
In the above image, you can see all the parent nodes like root, vis, util, etc in a different color, which is not in the color code range provided in the configuration. This is because the parent nodes do not have size value. We can change the color of those nodes with the help of a processor function available in colorAxis. This function helps us to choose the color code for particular nodes apart from the range.
Implementing Different Color for Parent Nodes
Now let us provide #D3D3C2 color for all the parent nodes, which do not have size value.
colorAxis:{
    scale:{
        type:'linear',
            range:['#FFC300','#571845']
    },
    minimum:0,
        maximum:16540,
        field: 'size',
        processor:function (axis, scale, node, field) {
        debugger;
        return Ext.isEmpty(node.data[field]) ?  '#D3D3C2' : scale(node.data[field]);
    }
}
Run Code
Save and run the example in a browser and you shall see the following output:
5. Handling select and deselect events
select and deselect events are fired on the treemap when a node is selected and deselected, respectively. So, we have to add listeners on the treemap for these events, as shown below:
listeners:{
    select:function(map,node){
        alert('Selected ' + node.data.name + 'Node');
    },
    deselect:function(map,node){
        alert( ' Deselected '+ node.data.name +' Node ');
    }
}
Run Code
Save and run the example in a browser and you shall see alert messages on selection and deselection of Nodes in the treemap. As the selection and deselection happens on click of nodes, you would be seeing both alerts – one after another. We can change the selection and deselection on dblclick, as well, with the help of selectEventName config on the Hierarchy class, which defaults to click.
Summary
In this Article, we have seen how D3 Layouts are structured in Ext JS 6.2.0 and we have implemented all the features provided by Hierarchy class, which is the parent class for all the D3 Layout classes in Ext JS, with one of the subclass TreeMap.
You may download the samples code from GitHub and give it a try. I will keep updating this article as and when I find more information. So feel free to share your comment and feedback.
Feel free to reach out to us if you want to understand how WalkingTree professional services team can help your project with advanced visualization using Sencha Ext JS and/or D3.
References
- D3.js
- Ext JS D3 Canvas API
- Ext JS D3 SVG API