One of the most important dimensions, when we talk about data analysis, is – Time. Same is applicable to IoT where we get data with timestamps and many of our visualization, analysis, and actions are based on how well and quickly we are able to measure facts for a time or time interval. KaaIoT is an Open Source IoT platforms that one can use to build and launch their private IoT platform in no time. KaaIoT offers various Log Appenders to log device data into a NoSQL database and that’s what it recommends for device data. One challenge however that we have been facing is that there are tonnes of good data residing inside an SQL/RDBMS and its cumbersome to migrate and manage them inside a NoSQL database for real-time analysis! And, the fact that our clients, customers and people are using RDBMS and will continue to do so. For those who are interested in SQL vs NoSQL:
- Check out this thread on Hacker News – Why SQL is beating NoSQL, and what this means for the future of data.
- In case you find following the conversation on Hacker News difficult, you may find Ajay’s article very informative and well laid out.
So, I was looking at a way to let our customers (and their developers) use RDBMS as their way to build and support applications and see how we can leverage the same RDBMS to offer IoT data logging and analysis capabilities. And, that’s when I came across Timescale – SQL made scalable for time-series data – and I was impressed (and mostly convinced) by this detailed article from Timescale CTO – Mike Freedman. So, I wanted to give it a try and see how this fits into the IoT use case and how the real-time data visualization can be offered where data can flow from the device to an IoT dashboard.
Timescale extends our existing PostgreSQL RDBMS database and offers fast query model to work with time-series data.
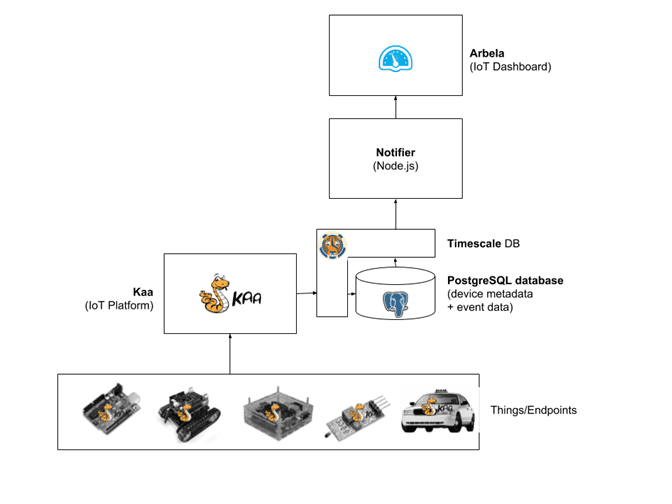
In this article, I will take you through the journey of using KaaIoT and Timescale to log device data and building some real-time time-series visualization using Arbela – an IoT ready configurable dashboard. Following diagram depicts the overall architecture of the solution where device data is logged by KaaIoT into Timescale and the Notifier pushes data immediately to Arbela for visualization:
In this article, I will be using the New York taxi trip data. I will be simulating a taxi as a KaaIoT client – using KaaIoT Java SDK – to send ride data.
Notifier is a Node.js based application that pushes data on WebSocket. Any client application (like Arbela) that is interested in that data will use WebSocket communication. In this article, I will be using socket.io.
Pre-requisites
- KaaIoT – 0.10
- PostgreSQL 9.6
- TimescaleDB – compliant with PostgreSQL 9.6
- Node.js 8
- Arbela
This article assumes that you are familiar with KaaIoT platform and related concepts. In case the assumption does not hold true for you, I recommend going through KaaIoT platform documentation.
Preparing time-series database
- Install PostgreSQL database and ensure that it is accessible to the KaaIoT host.
- Install Timescale
You may also install PostgreSQL and Timescale on Google Compute Engine.
- KaaIoT uses MariaDB as the default SQL database to store configuration and metadata. Follow the installation instruction to configure KaaIoT with PostgreSQL database.
- Create a database, import NYC Taxi data into it and configure for time series analysis. Verify by running some queries mentioned on that blog.
With these steps, our KaaIoT instance is pointing to a PostgreSQL, which has Timescale applied to it. For further reference, let us say following is our database configuration:
- Host: localhost (assuming you have everything running on one machine)
- Port: default PostgreSQL port
- Username: postgre
- Password: postgre
- Database: kaa
- Device data log table (also called Hypertable in Timescale): rides
Getting KaaIoT ready
Now, we need to extend KaaIoT so that we can log data into the PostgreSQL database. In this section, we will talk about configuring different aspects of KaaIoT platform so that it can receive data from a device and log it into a PostgreSQL table. For this, as KaaIoT does not have a default SQL log appender, I will be using my generic PostgreSQL log appender that can log device data to a SQL table.
Creating an application
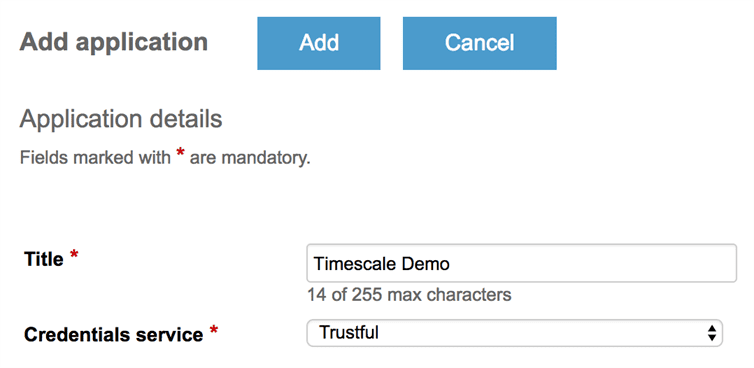
First, create an application, say, Timescale Demo, as shown below:
 Setting up the application Log Schema
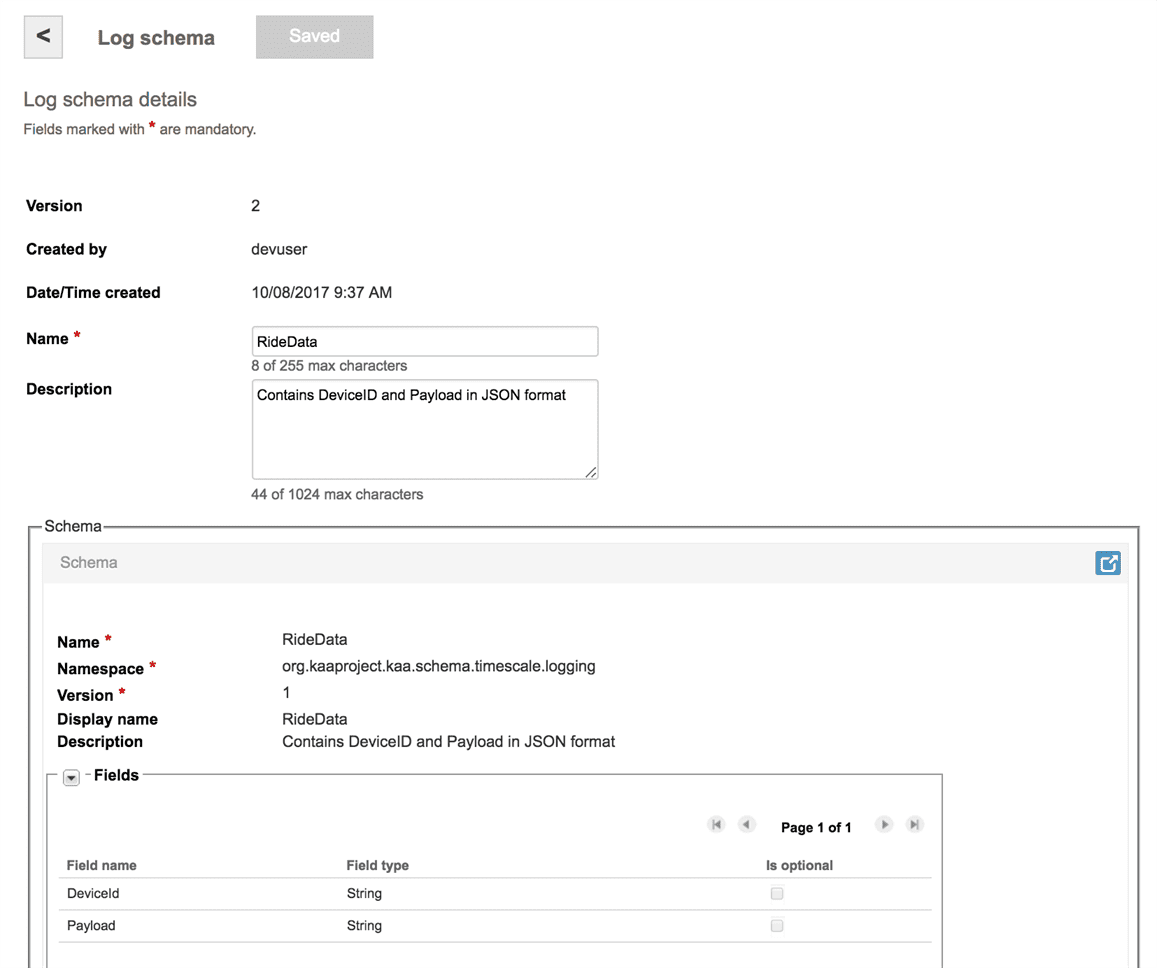
Once we have an application, configure the Log Schema with different fields, as shown below:
1 |
{"pickup_longitude":"1234","fare_amount":"1234","pickup_datetime":"1234","passenger_count":"1234","tolls_amount":"1234","dropoff_latitude":"1234","improvement_surcharge":"1234","rate_code":"1234","trip_distance":"1234","dropoff_longitude":"1234","payment_type":"1234","total_amount":"1234","pickup_latitude":"1234","vendor_id":"1234","extra":"1234","tip_amount":"1234","mta_tax":"1234","dropoff_datetime":"1234"} |
If you notice, the fields match with the columns on rides tables. I have used this to simplify some of the log appender logic. But, you are free to use any field names. Accordingly, your log appender logic shall change.
Setting up the application Log appender
Now, setup the Log appender. I have selected my Timescale/PostgreSql appender, as shown below:
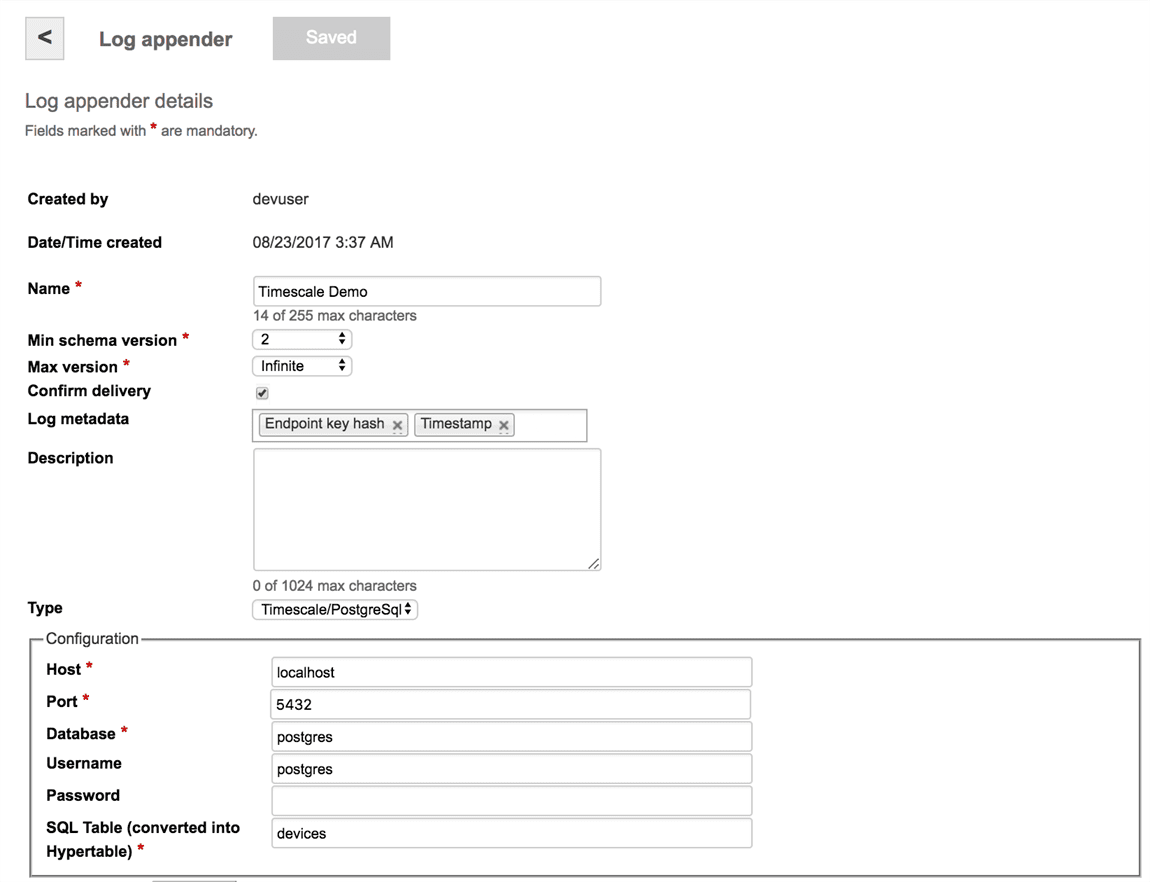
The log appender pulls out the columns metadata for the specified table and matches the incoming JSON data fields to the column names and sets their value based on the column’s data type. Once the final SQL statement is prepared, it inserts the record and notifies clients listening on nycnotifychannel channel. It uses PostgreSQL NOTIFY statement to notify listeners.
Getting Taxi simulator ready
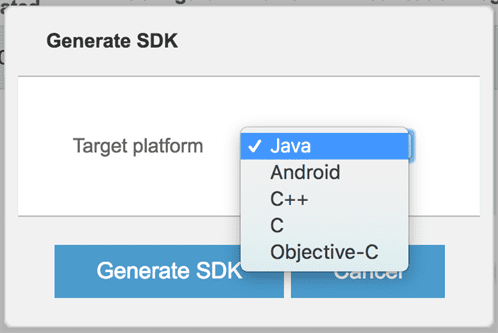
In order to build the Taxi ride simulator, first, we need to add a SDK profile to the application, as shown below:
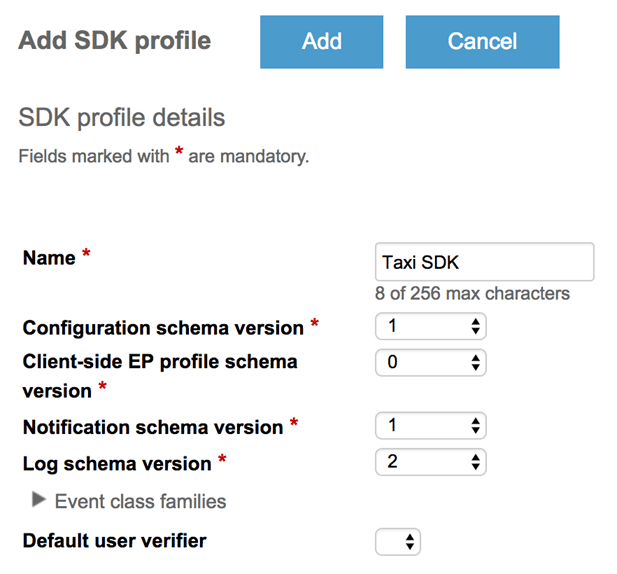
This will download a JAR file on your system. Use this to create the client application. You may refer to https://walkingtree.tech/using-arbela-as-kaa-iot-dashboard/ for detailed steps related to Log Appender and building client/end-point application.
Getting Notifier ready
Notifier is a Node.js based Websocket server that listens to nycnotifychannel channel of PostgreSQL. As soon as it is notified by the log appender, it runs queries and pushes their responses to the websocket. Here is a sample notifier code:
1 2 3 4 5 6 7 8 9 10 11 12 13 14 15 16 17 18 19 20 21 22 23 24 25 26 27 28 29 30 31 32 |
var io = require('socket.io').listen(9000); var pg = require ('pg'); var con_string = 'tcp://postgres:@localhost/kaa'; var pg_client = new pg.Client(con_string); pg_client.connect(); console.log("Connected to TimescaleDB. Listening..."); var query = pg_client.query('LISTEN nycnotifychannel'); io.sockets.on('connection', function (socket) { console.log('Socket connected!'); socket.emit('connected', { connected: true }); socket.on('ready for data', function (params) { console.log('Ready for data!', params); pg_client.on('notification', function(msg) { console.log("TimescaleDB notified..."); var avgFare = "SELECT date_trunc('day', pickup_datetime) as day, avg(fare_amount) FROM rides WHERE passenger_count > 1 AND pickup_datetime < " + params.since + " GROUP BY day ORDER BY day;"; pg_client.query(avgFare, (err, res) => { if (!err) { socket.emit('update', { message: res.rows }); } }); }); }); }); |
Configuring Arbela for real-time visualization
Now, that we have the notifier in place which is listening on port 9000 for a Websocket connection, we need to configure Arbela to use Websocket communication to receive pushed data and present them in real-time.
Arbela is a configurable IoT dashboard application, which one can use as a starting point of their IoT visualization needs. Get Arbela up and running by following these simple 3 steps.
Configure Datasource
First, create a datasource of TimescaleDB Notifier type and configure.
Since is a way to limit the dataset that we want to use for the analysis. If we want to consider data till today, we will pass today’s date.
Configure a card (visualization widget)
With datasource in place, now, create a card for visualization. In the below image, I am creating a bar chart that presents daywise facts. This is ideal for our Recent 5 days rides total use case.
Our Notifier is sending data in the following format:
1 |
{recent_5days_rides: [{day: ‘2017-10-09’, val: 12364}]} |
Same will be received on the Timescale datasource that we created earlier. So, the Data expression is:
1 |
datasources[‘Timescale’].recent_5days_rides |
With all the setup and configuration in place, now I run the client application and I can see real-time rides data presented as bar chart (notice the count in tooltip showing the recent value), as shown below:
Here are more cards added – one to show average fares for raides with 2+ passengers and other one to show rate wise rides count – and each one being updated asynchronously as the data arrives for a card
Summary
Timescale offers the much needed time-series analysis without throwing away the existing SQL ecosystem and its performance figures are very impressive. And, with its non-intrusive API model requires no special training and works seamlessly with non-hypertables. I loved the fact that how straight forward it is to get started and use it with a huge data set. And, with Kaa’s and Arbela’s architecture, putting the whole solution together was a trivial task. So, Timescale, KaaIoT, and Arbela together form a good solution for our customers who are looking to extend their existing SQL database for real-time time-series analysis use cases.
Do reach out to us in case you want to learn more about Timescale or you want to understand how you can use your existing SQL database for your IoT use cases.

 Setting up the application Log Schema
Such a helpful article! Thank you a lot for sharing. It cleared up a lot of things for me.