

Blogs
Leveraging Power BI for advanced analytics through rich data visualization and excellent dashboards
See how Power BI (a cloud-based business analytics service) enables businesses to track the health of the organization with live dashboards and interactive reports from anywhere, at any time.
Business intelligence (BI) technologies are transforming how firms conduct business across the board, from sales to operations to finance and even executive management. Today many businesses have jumped on board and are reaping the benefits. According to research by the International Data Group, 69 percent of businesses are considering or implementing a business intelligence solution.
The primary purpose of BI is to simplify the process of interpreting vast amounts of data for users. The information can also assist a company in finding new prospects and developing an effective strategy that will provide it a competitive advantage over its competitors as well as long-term stability.
Overall, it simplifies the process of information discovery and analysis while enabling decision-makers to access, interpret, analyze, collaborate, and act on data as needed. When it comes to business intelligence, companies are increasingly looking to invest in pre-built, strong solutions that are designed to give role-based, intuitive intelligence to front-line staff and top management.
Power BI, for example, gives you the tools you need to analyze your data and keep your organization running smoothly. It also gives you the tools you need to conduct a better strategic study of how you can consolidate your data streams, increase accessibility, and obtain sharper insights.
Let’s take a look at what Power BI is, how it works, and how it might benefit your expanding company.
Power BI is a collection of software services, apps, and connectors that work together to turn unstructured data into logical, visually immersive, and interactive insights.
It is a user-friendly, budget-friendly tool for Business Intelligence and Analytics and has numerous benefits like:
- Creating deeper insights
- It is a self-service platform that unifies all enterprise data analytics requirements on a single platform.
- Helps build machine learning models, and find insights quickly from both structured and unstructured data
- Improves publishing efficiency by quickly identifying differences. Helps move content easily from development and testing to production with confidence using the simple visual cues in deployment pipelines
- Knowing how to integrate Excel queries, data models, and reports to Power BI Dashboards is simple if one is familiar with Microsoft 365
- Combining Power BI with Power Apps and Power Automate will help easily build business applications and automate workflows
- Helps in timely decision making, be it from factory sensors to social media sources, allows access to real-time analytics
Power BI- The Key Features
Power BI desktop that is interactive
Power BI Desktop is a holistic development tool for Power Pivot, Power Query and Power View. With Power BI Desktop you will have everything under the same solution, and it is easier to develop BI and provides a better data analysis experience. Once the data connections and integration is implemented, this interactive Power BI desktop tool enables you to create reports by instantly accessing data. It is quick and simple to understand how to use. The best part of this application is that it is completely free to download and use, allowing you to make and view reports easily in real-time.
Visualization that is unique to you
Every corporation operates differently and has its own method of accomplishing tasks. There are times when the correct path is the standard path. The same is true in the case of visualization.
Because of the complexity of the data, the Power BI tool has a default standard that is sometimes insufficient for companies. In such cases, businesses can quickly access the custom visualization library and develop a visualization that meets their demands.
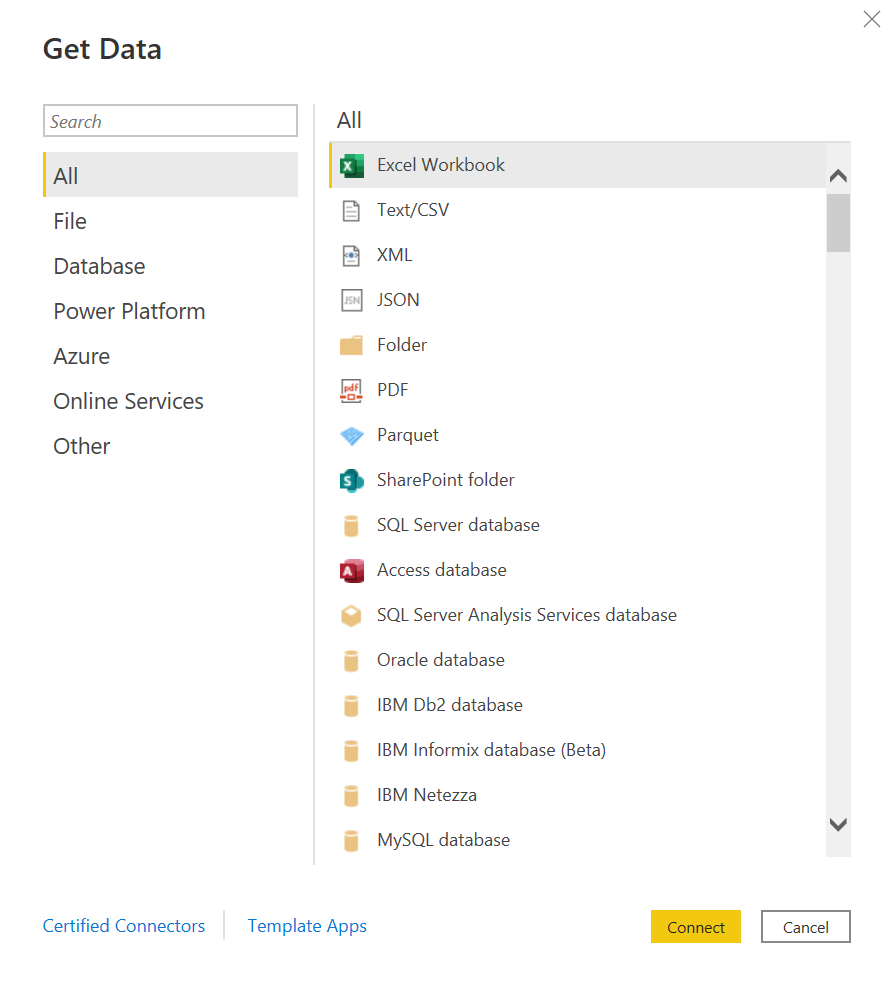
Ability to connect to multiple data sources
Power BI can import data from the best-known databases and services using various file formats.
Data is at the heart of all businesses, and the fundamental difficulty that firms confront today is combining data from different sources to generate usable insights.
Well, one effective technique to accomplish this is to collect multiple datasets and visually organize them for better understanding. This aids in providing a more in-depth knowledge of the data, allowing firms to get a competitive advantage over their competitors.
Cost of Power BI
When comparing Power BI to other data visualization tools and other solutions, pricing is one of its significant features. There are three kinds of Power BI per-user licenses: Free/Desktop, Pro, and Premium Per User. Power BI Desktop has enough features for a beginner to get started with data visualization and when explored it leaves its users with numerous options to visualize the data. The sort of license a user needs is determined by the location of the content, how they will interact with it, and whether or not the content uses Premium features. The sort of license your company has determines where content can be stored. Learn more about licensing. https://docs.microsoft.com/en-us/power-bi/fundamentals/service-features-license-type#licenses-and-license-types Learn more about pricing details here https://powerbi.microsoft.com/en-us/pricing/
Provides high level data security
Users of Power BI can take use of a variety of security features, including dynamic row-level security. This security feature allows users to encrypt an entire data file as well as conceal a portion of it. The responsibilities granted to users can be fine-tuned at the granular level to control team members’ access to and activity on the data. It should be mentioned that in order to enable this security structure, all features in the desktop and cloud-based components of the Power BI tool must be correctly activated.
Apart from creating a traditional security layer, the Power BI enables for developing security that allows the team to grant access in a controlled manner. The on-premises gateway can also be used to investigate data sets stored on the company’s server. It becomes easy to compare website visitors to sales or promotions to client acquisition in this manner. It has drag-and-drop data navigation, a large library of interactive visualizations, report generation, and quick publication to the Power BI service.
Question and Answer (Q&A) in Real-time
Sometimes the fastest way to get an answer from your data is to perform a search over your data using natural language. The Natural Language Q&A box is a unique feature of Power BI, which enables a user to ask questions in natural language to search for data and information available in the Power BI system. The way the data should be presented can also be specified with the questions. The Q&A feature may be the most frequently mentioned capability for establishing self-service BI.
Power BI gathers and maintains all on-premises and cloud data in a single, centralized location that can be accessed whenever needed. There are also pre-packaged content packs that can be used. The system allows for quick and easy data exchange. The drag-and-drop gesture aids in the identification of trends and natural language questions for quick responses.
Power BI is one such application of Microsoft that has broken new ground in applying Artificial Intelligence to Business Intelligence by means of Natural Language Processing, machine learning, and advanced analytics.
It has made AI & ML accessible by building the models and codes and by integrating it into the software. The data extracted from Power BI reports is applied to machine learning models in a way that generates helpful insights for further Data Analytics.
So those are some of the features of Power BI. Now, let’s take a closer look at what enables Power BI to generate actionable insights.
When it comes to Power BI, it is a solution that enables data analysis to be quick, agile, and user-generated. It not only makes data collaboration, analysis, and sharing easier, but it also pushes it to the next level.
Power BI’s major components
Power Pivot
To create in-memory data models, this component imports and combines various datasets from various sources. Any functional user can easily boost the total value by merging multiple data sources. Thanks to this integration, that makes it easy for analysis and decision-making when corporate data such as sales/inventory/demographic/weather data is evaluated using this tool.
This component also allows complicated calculations, data modeling, KPIs and other indicators, which data analysts can utilize to prototype and analyze various business scenarios.
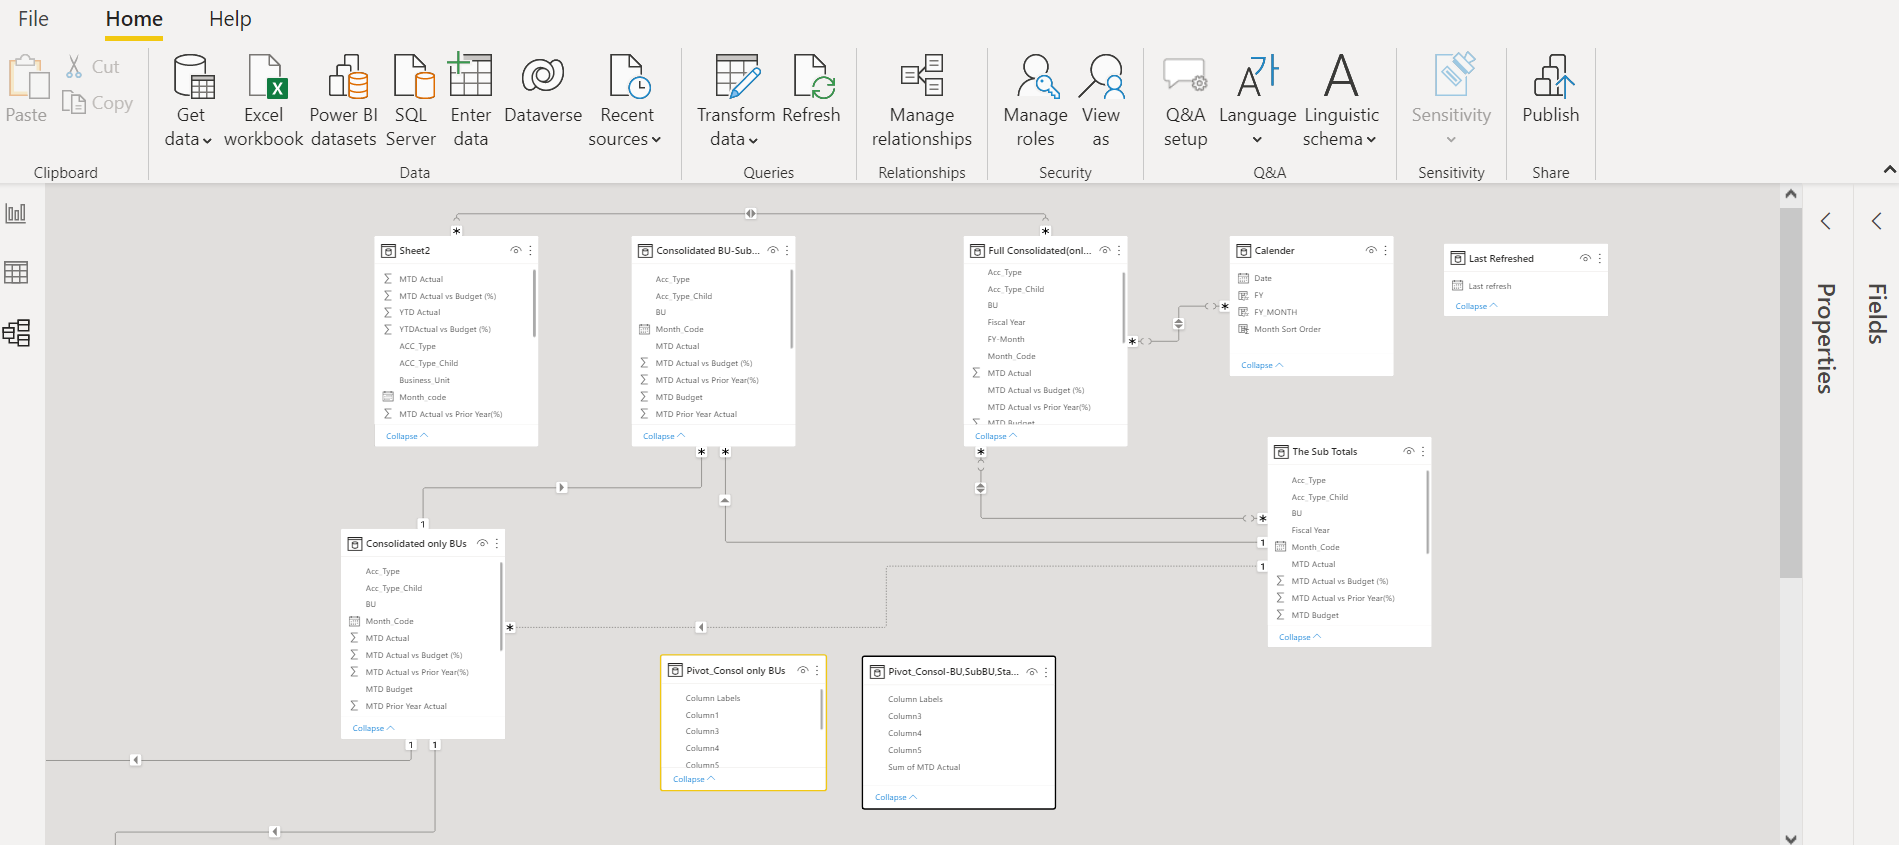
Data modelling
Power Query
Power Query is a data transformation engine. This component searches for data in multiple corporate data sources or on the internet, and the selected dataset is then smoothly loaded into an Excel table, which many analysts find to be a game-changer. This component’s native data connectivity functionality allows for faster and easier access to data.
Renaming a column, replacing values, merging data, and other significant data alterations are all handled by Power query. This is a crucial component since it makes data cleansing and structuring a breeze.
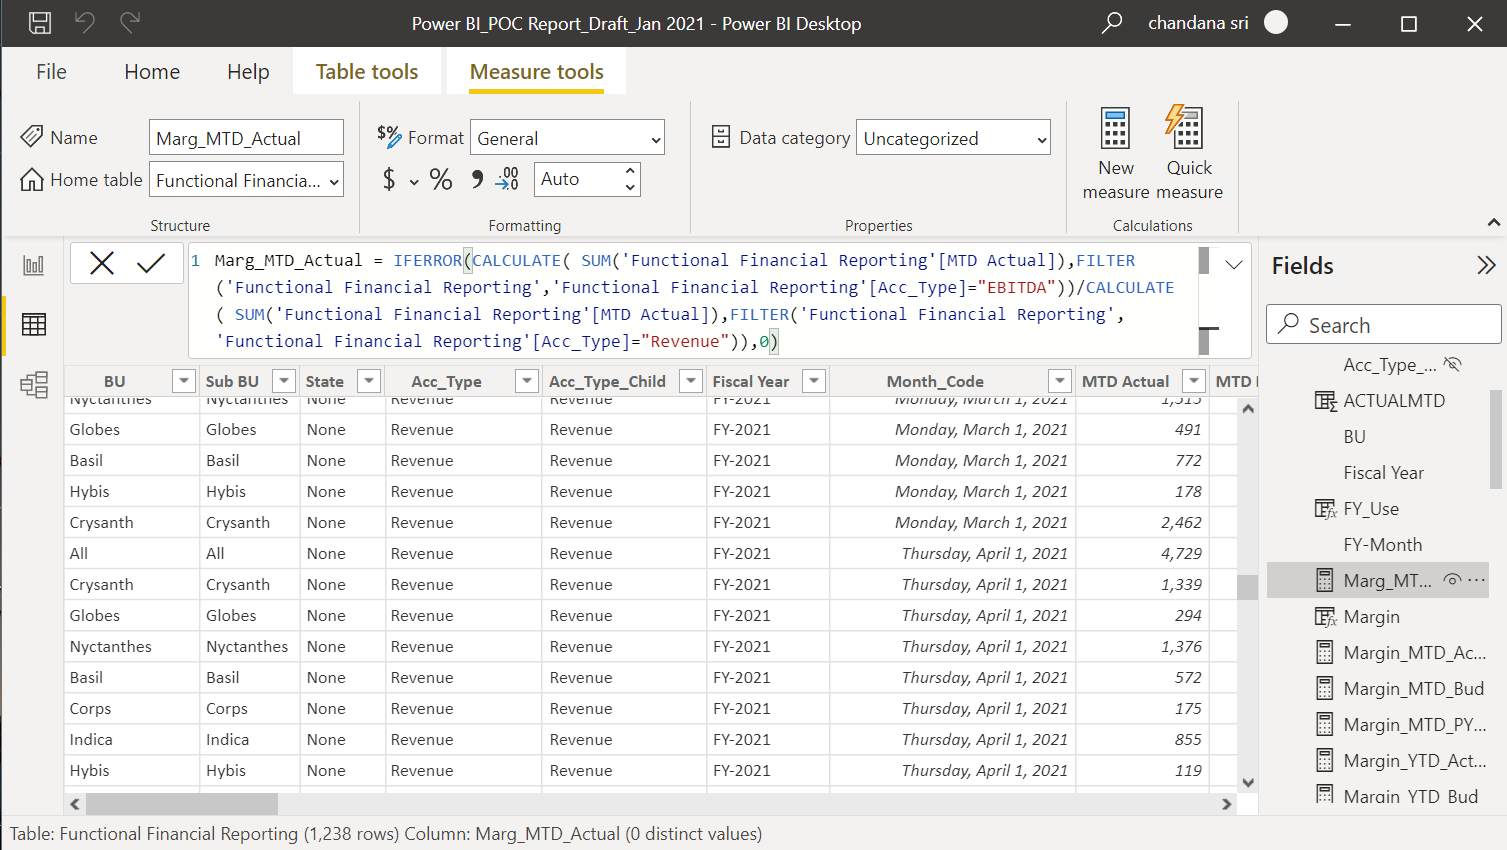
Usage of Power Query and Data Analytics Expressions
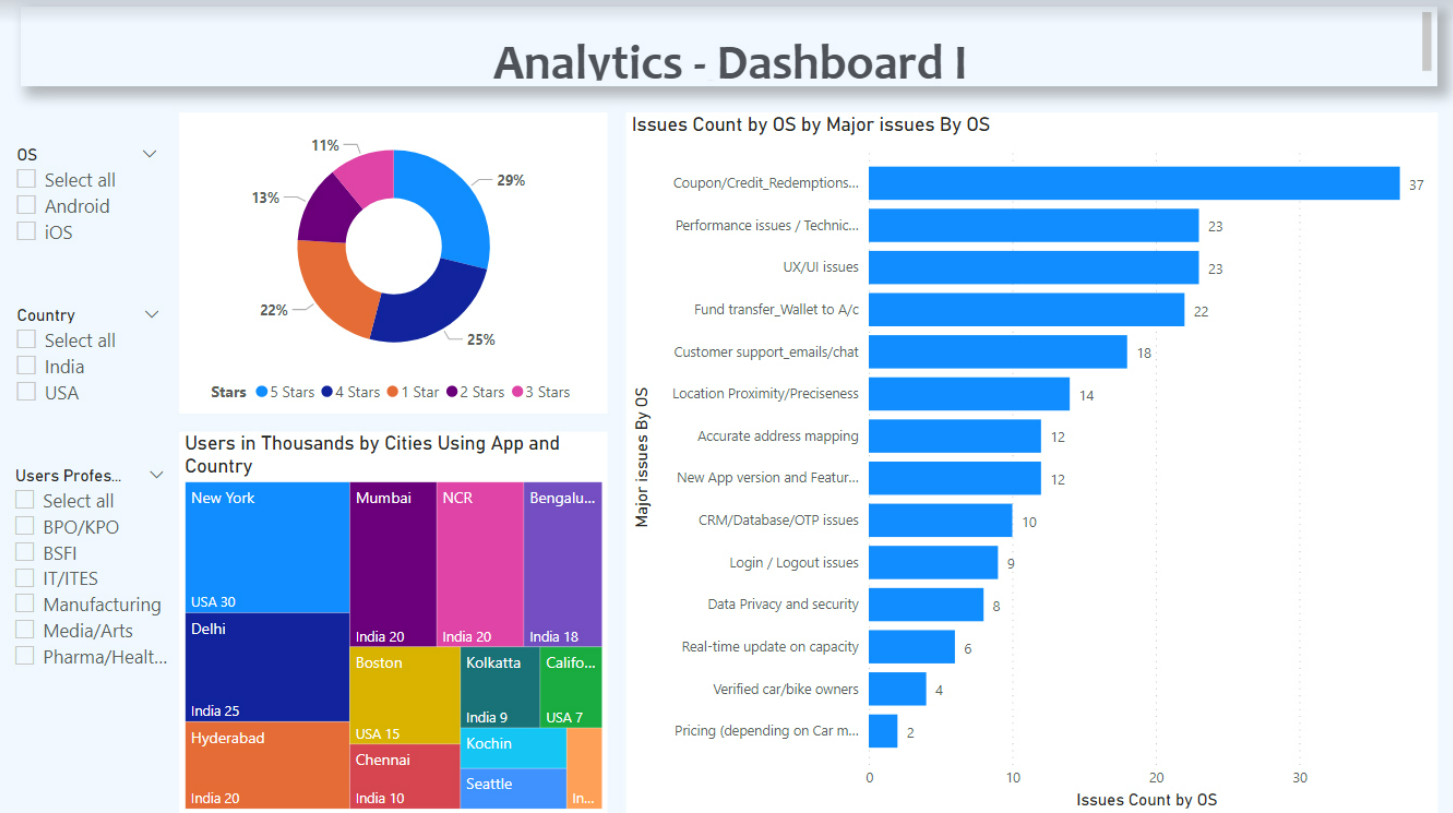
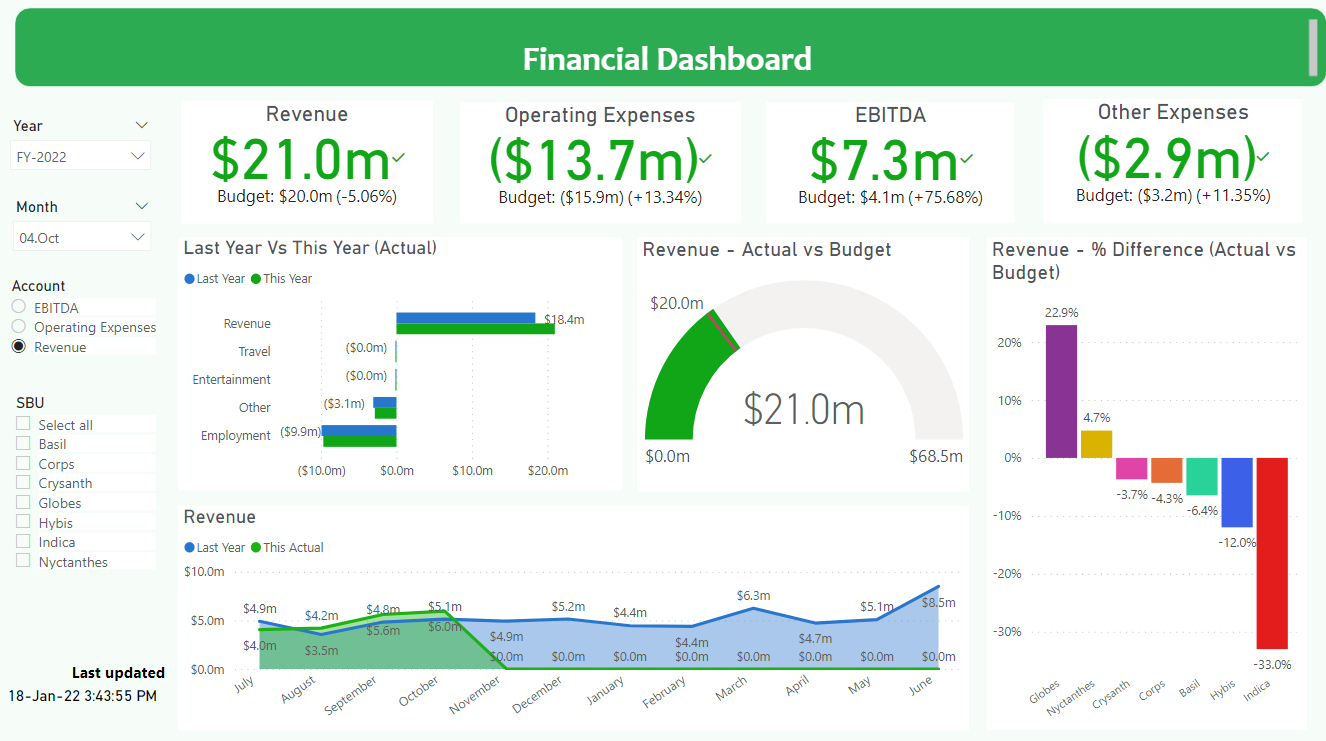
Power View
Power view is the main data visualization component of Power BI. Power View helps in viewing the data and making it more interactive. It is designed to highlight and cross-filter the data.
In addition to charts, graphs and tabular data, Power view also includes a variety of maps with zoom and pan capabilities.

Ease of Implementation
Small and mid-sized firms have traditionally found it challenging to implement relevant Business Intelligence systems. Most small business owners and accounting experts are aware of the challenges and how they want their dashboards to be presented, but setting up the BI models often necessitates the assistance of an experienced programmer. Finally, setting up a BI application would take a long time and a lot of money. Many business intelligence solutions are abandoned since your requirements have changed by the time they’re put up.
Power BI can be implemented in a considerably short span with some help from technical experts. Power BI may be used to show data for IT monitoring tools as well as business users with massive amounts of data. Different use cases necessitate various degrees of data in their dashboards.
Taking all of this into account
Due to the recent data boom, other BI tools are gaining popularity, however, Microsoft’s Power BI stands out due to its sophisticated features at a reasonable price. Although Microsoft Power BI is still in its early stages, it has already established itself in the industry. It is rapidly evolving and will become an increasingly important part of Microsoft’s BI strategy.
You may obtain an advantage over your competitors and position your firm for long-term growth by combining WalkingTree’s broad capabilities with a unique business intelligence solution like Power BI. Do you want to see how Microsoft Power BI may help your company achieve better results? Schedule a WalkingTree demo today to see how our Power BI solutions can help your company develop.
References:
- https://docs.microsoft.com/en-us/power-bi/fundamentals/power-bi-overview
- https://powerbi.microsoft.com/en-us/why-power-bi/