Apache Superset: Exploring big data canvas with future-ready custom data visualization tool

Data visualization can be the new storyboard for your business strategy and planning. Extracting business-relevant and contextual insights from raw business data and putting them into visually engaging dashboards and intuitive visual reports is what leading business intelligence (BI) and data visualization tools promise. There are quite a few tools that do this well, right? Well, many of these tools have certain drawbacks that prevent them from wider acceptance. Some of the shortcomings that easily come to notice are steep learning curves, concerns corresponding to scalability, issues with system compatibility, and lack of business-specific customization. In all these areas, Apache Superset comes as a winner.
There is widespread consensus that data visualization is part and parcel of business reporting and decision-making processes. But in terms of scalability, most data visualization tools often crumble when data volume reaches petabytes. This is one area where Apache Superset brings you the promise of unparalleled scalability irrespective of the data volume. Superset is all set to handle ever-growing volume and complexity as your business evolves. On top of everything, it is extremely lightweight and compatible with a variety of system configurations.
It works with a variety of web servers, messaging engines, databases, and data processing services. It is an open-source tool to give you relief from the platform-specific obligations that several other tools already adhere to. No wonder, many of the leading companies around the world as well as startups have already started incorporating Superset in their workflows. Last but not the least, Apache Superset now gets the support of a continuously growing community.
Here throughout this blog post, we are going to explain the Apache Superset architecture, its key value propositions, comparison with its counterparts and provide a step-by-step guide to using the tool for creating dashboards and data visualizations.
3 Principal Layers of Apache Superset
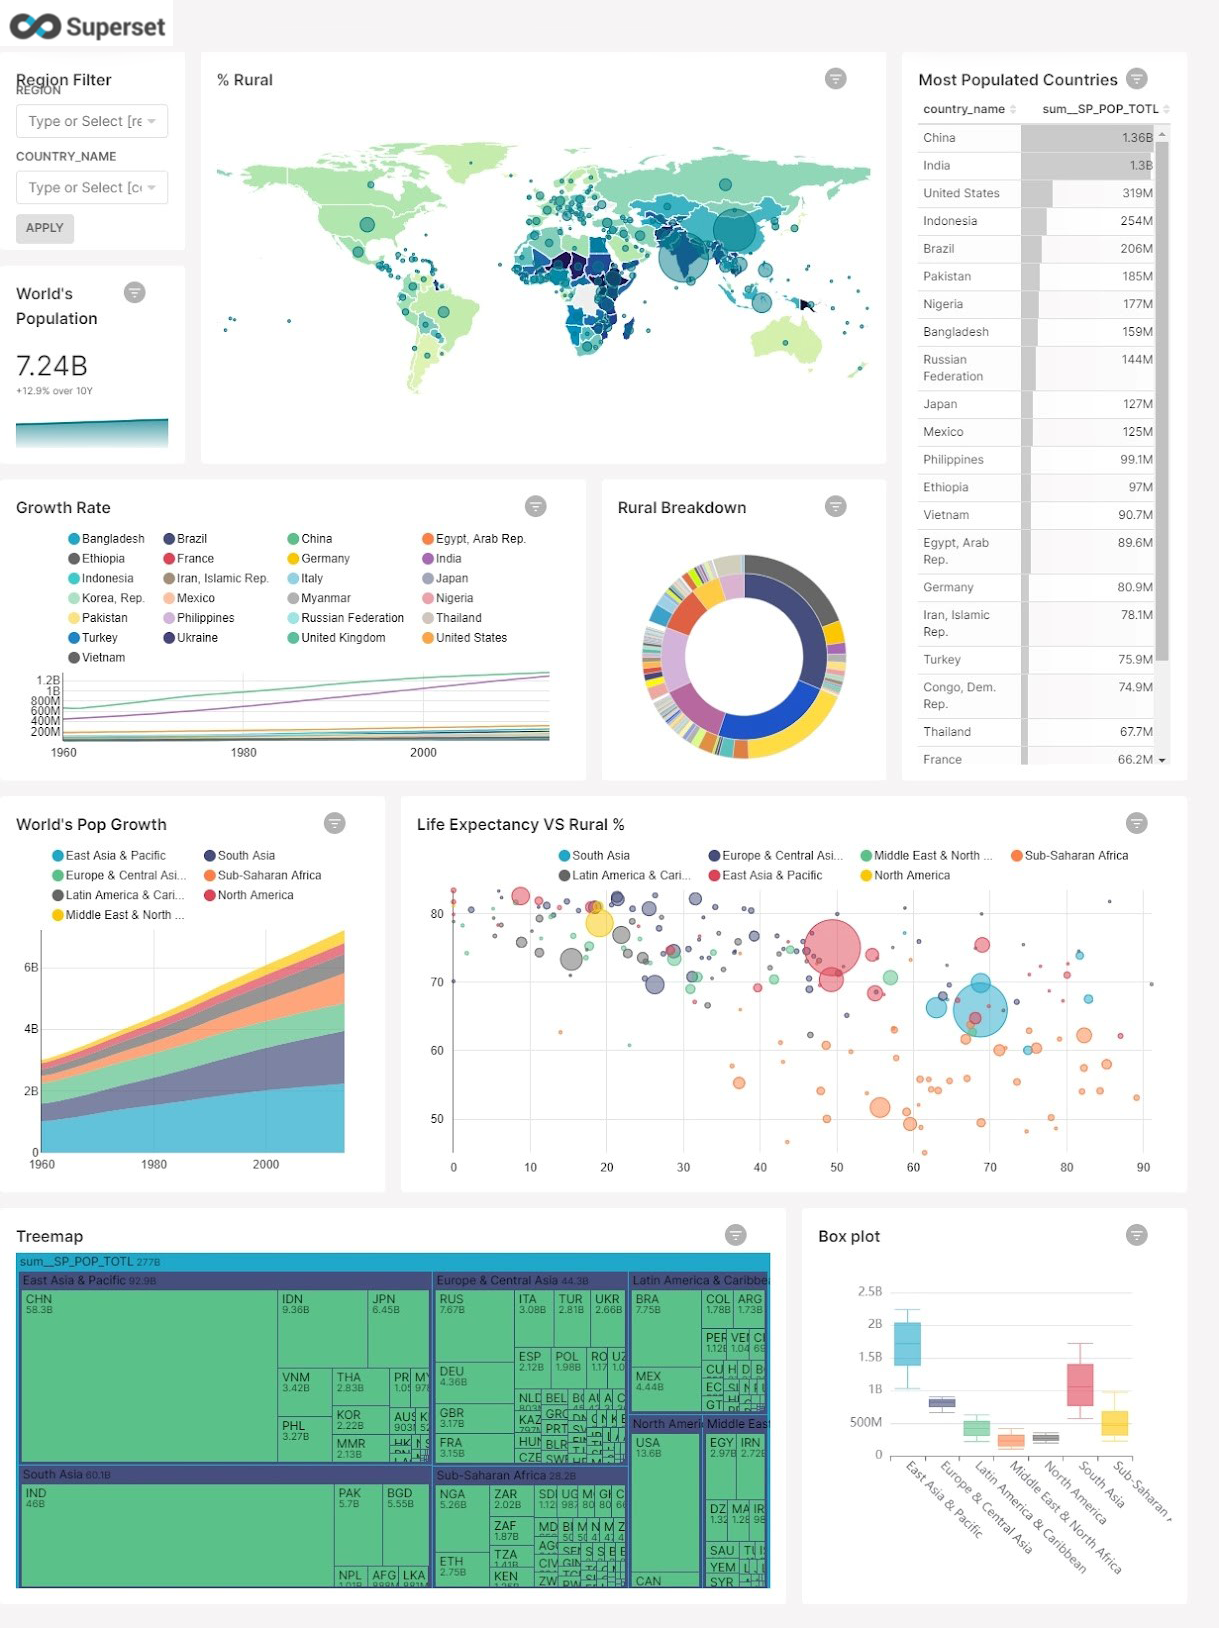
Apache Superset is capable of working on 3 principal layers. Let’s explain them one by one.
Visual Dashboard Building
The primary and most sought-after capability of Superset is creating intuitive visual dashboards. For visual dashboarding, it offers the following features.
- Allowing interactive dashboard building by seamlessly interacting with a variety of ready-to-use tools.
- Easy development with simple drag and drop actions.
- A wide range of supported formats and channels such as URL, email, JSON, and a few others for sharing the dashboards.
Data Exploration
Another key facet of Apache Superset capabilities is exploring data for relevant business insights and presenting them through intuitive visual reports. For data exploration, Apache Superset offers the following features and capabilities.
- Allowing you to create data visualization without coding.
- Robust ability to extract deep-lying data insights and present them in a visually engaging manner.
- Intuitive and engaging data interface.
- Availability of a wide number of ready-to-use, preconfigured, and custom plugins for unique data visualization output.
- Allowing to use of business-relevant metrics defined by the users along with semantic layers.
- Ability to exercise complete control on the data visualization through separate SQL statements.
SQL Powerhouse
The last but not the least facet of Apache Superset is the ability to use and accommodate SQL queries for database handling and data exploration. For SQL query handling Superset offers the following features and capabilities.
- Apache Superset uses a React-based and richly featured SQL IDE.
- It can accommodate handling several different queries through multiple tabs.
- It facilitates querying metadata across different partitions, indexes tables, and columns.
- It supports persistent results for long-running queries.
- It allows querying based upon custom and user-preferred metrics.
- It supports interaction-based querying, access to query history, query scheduling, and autocomplete querying.
Apache Superset vs Its Counterparts: Comparing Key Value Propositions
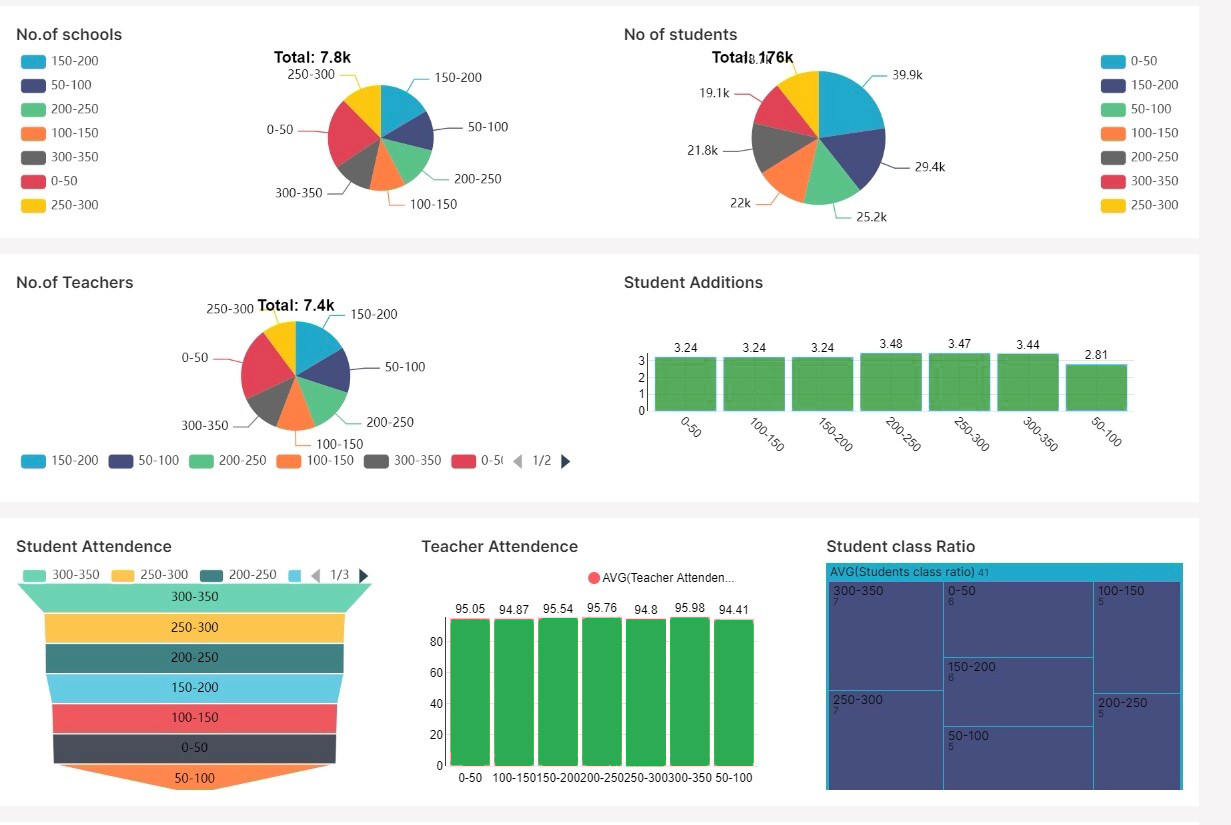
Apache Superset in more than one way allows you to do a lot with your data and that too, by using just simple SQL queries. When you have Apache Superset on your side, just by using the most common SQL database queries you can create insight-rich visualization out of large datasets. You can provide users with more custom controls and custom views of the data. When it comes to learning curves, scalability, flexibility, and customization options, Superset fairly stands way ahead of its counterparts in many ways.
But all are not rosy and glimmering for Apache Superset and however few are they, it has its shortcomings as well. For example, there are BI and data visualization tools with comparatively better data cleaning and data sanitization capabilities. The faster loading time of dashboards is another area where some counterparts give better output. Some tools belonging to the leading Cloud ecosystems are preferred for their Cloud-based operational capabilities. Some counterpart tools are more equipped for handling by large groups while Superset is mostly for individual use cases.
Now let us try to figure out the key comparative differences between Apache Superset and its competitors against various parameters.
- Apache Superset vs Tableau
When out for comparison with Superset, the foremost one that draws your attention is Tableau. First of all, Tableau is not free and it is offered at different price brackets while Apache Superset is open source and completely free to users. Tableau is feature-rich and high-performance Software but it involves more complexity and a higher learning curve compared to Apache Superset. In some areas such as data cleaning and sanitation, Tableau with its Tableau Prep ensures extensive cleaning capabilities. When HyperDB is integrated within Tableau, it boosts the loading speed of dashboards to a great extent.
- Apache Superset vs Pentaho
Pentaho in terms of data intelligence capabilities is still one of the most popular tools. Unlike the open-source and completely free Apache Superset, Pentaho comes with a community-based free edition with fairly robust BI and data visualization features and an enterprise edition with some additional features. Multiple platform support and faster loading time based on in-memory caching are two things where it stands close to Apache Superset. But Pentaho comes with separate editions and unlike Apache Superset it offers most of the advanced features and support with the enterprise edition.
- Apache Superset vs Google Data Studio (GDS)
When it comes to data visualization tools for the web, Google Data Studio (GDS) is extremely popular. But despite coming from one of the world’s most dominant tech ecosystems, organizations are increasingly moving to Apache Superset for the sake of extreme ease of use, simple role management capabilities, more granular level filters, and exponentially growing community support. It has also been noticed that Superset offers better data extraction and exploration capabilities than GDS. While close integration with Google Cloud is always taken as a key positive attribute of GDS, now Apache Superset also ensures that same level of connectivity.
- Apache Superset vs Power BI
Microsoft Power BI is another popular and widely used data visualization tool that started its journey as an extension of Microsoft Excel. Despite offering an easily manageable learning curve, easy-to-engage interface, and seamless integration capabilities, it lags behind most of the advanced tools we are discussing here. Many developers complain about scalability issues in handling large datasets by Power BI, at least if you do not subscribe to the Premium version.
- Apache Superset vs Looker
The new promising kid in the burgeoning and buzzing block of data tools is Looker. Looker has achieved its prominence because of its extensive feature set and advanced capabilities. It comes with its machine learning tool called LookML and offers extensive SQL and Cloud support. Some advanced features such as semantic layers, dashboard permission protocol, role-based access control, and SaaS Cloud support are common to Apache Superset as well. In comparison, Superset has a lower learning curve and low complexity level compared to Looker. In terms of programming language support also, Superset stands fairly ahead by supporting advanced languages such as Python, ReactJS, and TypeScript. Lastly, Apache Superset ensures more context-driven customization options and remains more scalable to accommodate large-scale data extending to petabytes.
- Apache Superset vs Metabase
Metabase is probably the most complete tool to challenge Superset. As for data sources, Superset has access to a larger number of SQL databases and SQL engines compared to the Metabase. While both offer no-code query builders to extract data-driven insights, Superset offers more data visualization features between the two. For advanced SQL editor capabilities, both stand neck to neck. As for enterprise features, Superset still doesn’t provide hybrid development while Metabase does. So, in overall measures, both tools come very close in capabilities with a handful of brownie points won by Apache Superset.
A Step-by-Step Way to Create A Dashboard with Apache Superset
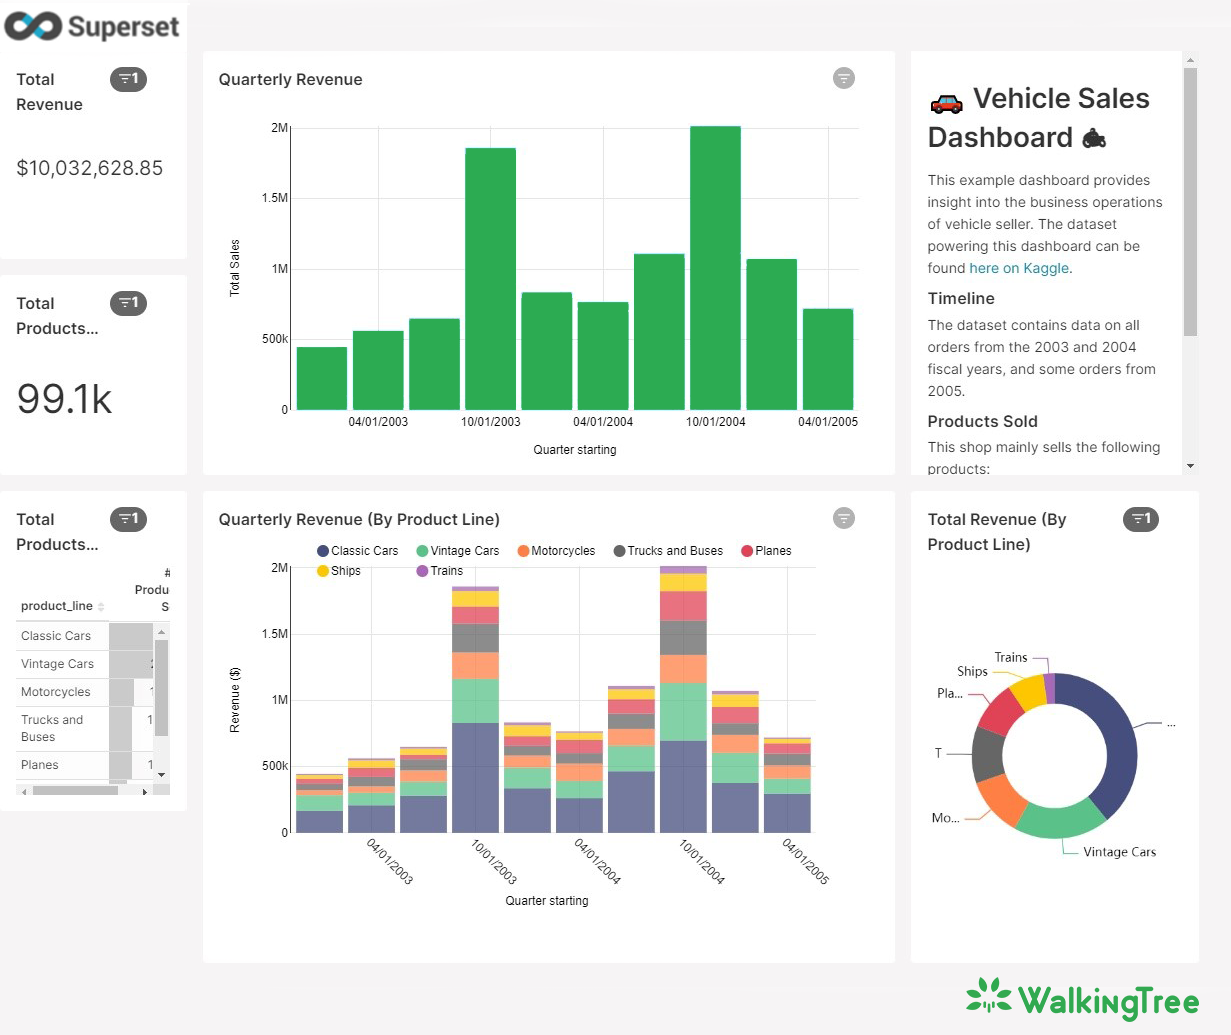
Now you already gave some idea of what Apache Superset is up to and up against. Now you must be eager to know how the tool works for creating data dashboards and visualization. Let’s explain how Apache Superset can be used to develop intuitive dashboards and data exploration workflows.
Pairing a new database
Ohh well, let’s remember that Apache Superset doesn’t offer us any storage. Because of this, you need to pair it with a database or data store. You can opt for the existing SQL database as an easy option. Let’s explain how you connect these two.
To begin with, you have to equip the database with respective credentials for the connection. The connection credentials in the database will allow Superset to make queries and create visualizations by using the database. Another way to do it is to use Superset through local Docker compose so that an inbuilt and preconfigured Postgres database in the Superset called examples will help you to do the same.
Just go to the Data menu and from there choose the Database option. You need to tap on the database button now in the top right of the screen.

Within this window, there are also several advanced configurations available and for this, you are required to mention the name of the database and the URL of SQLAlchemy as shown in the image below.
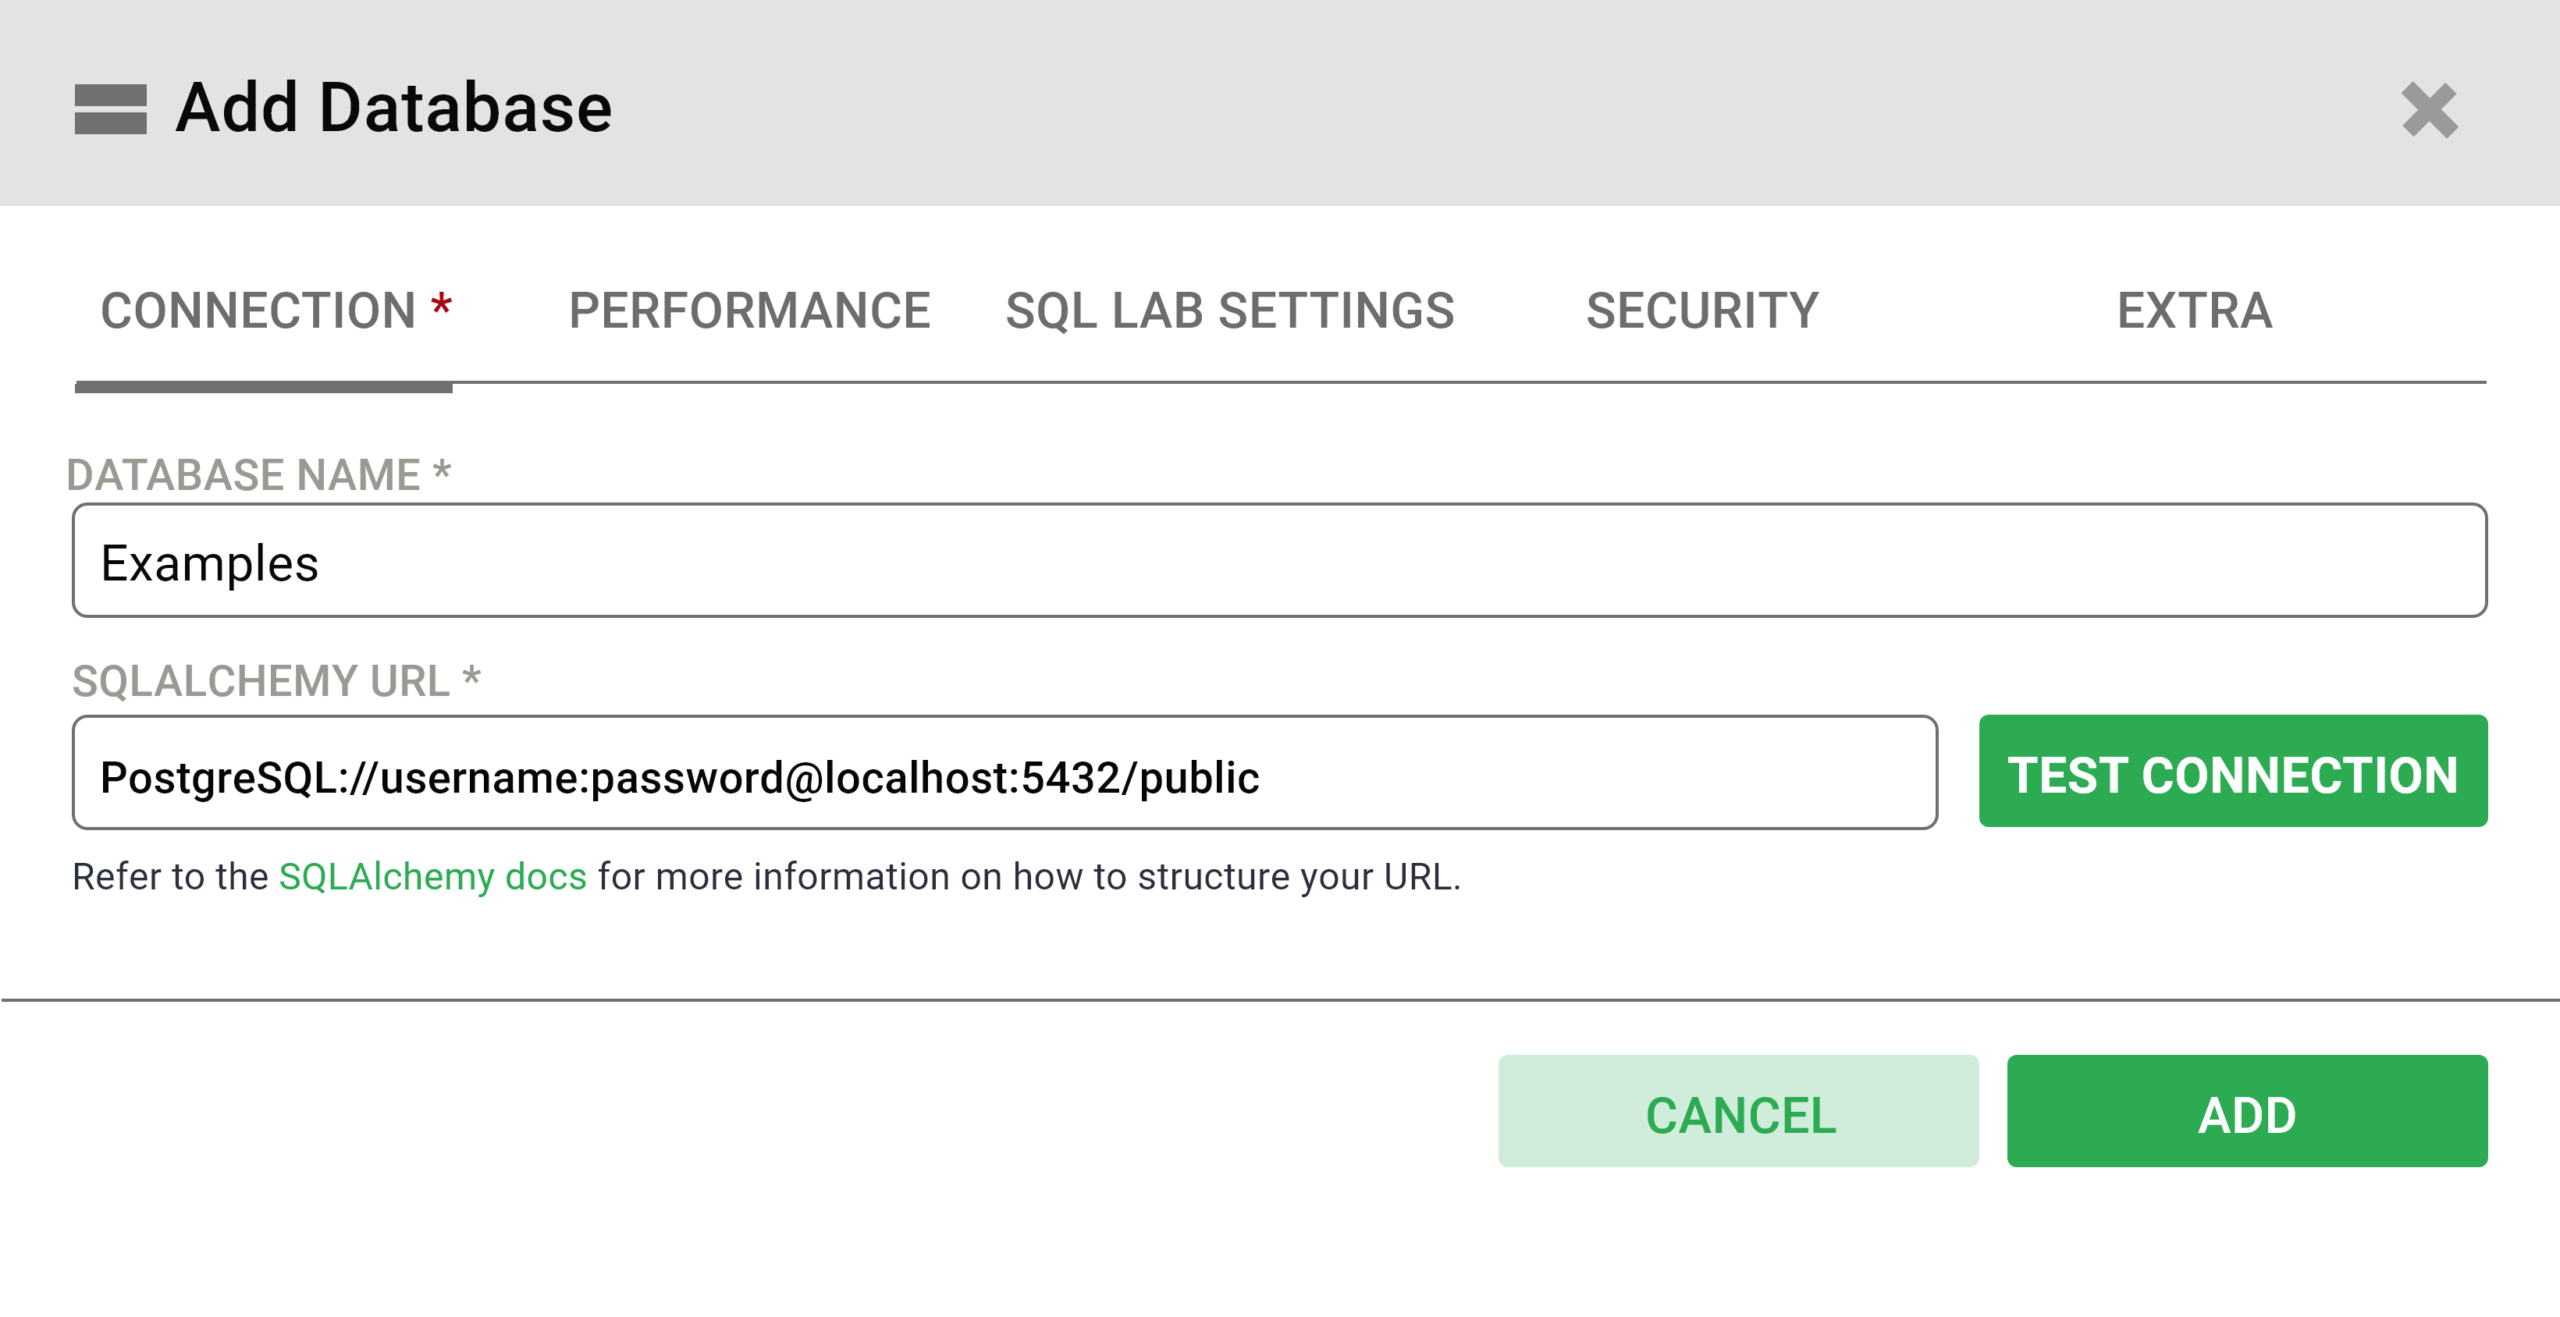
Tap on the button for Test Connection to make sure that everything just works as per expectations from beginning to the end. Once you find it workable and effective, you need to just save the configuration by simply tapping on the Add button on the right bottom. With this, you just have finished adding a new database.
Preparing a new dataset for querying
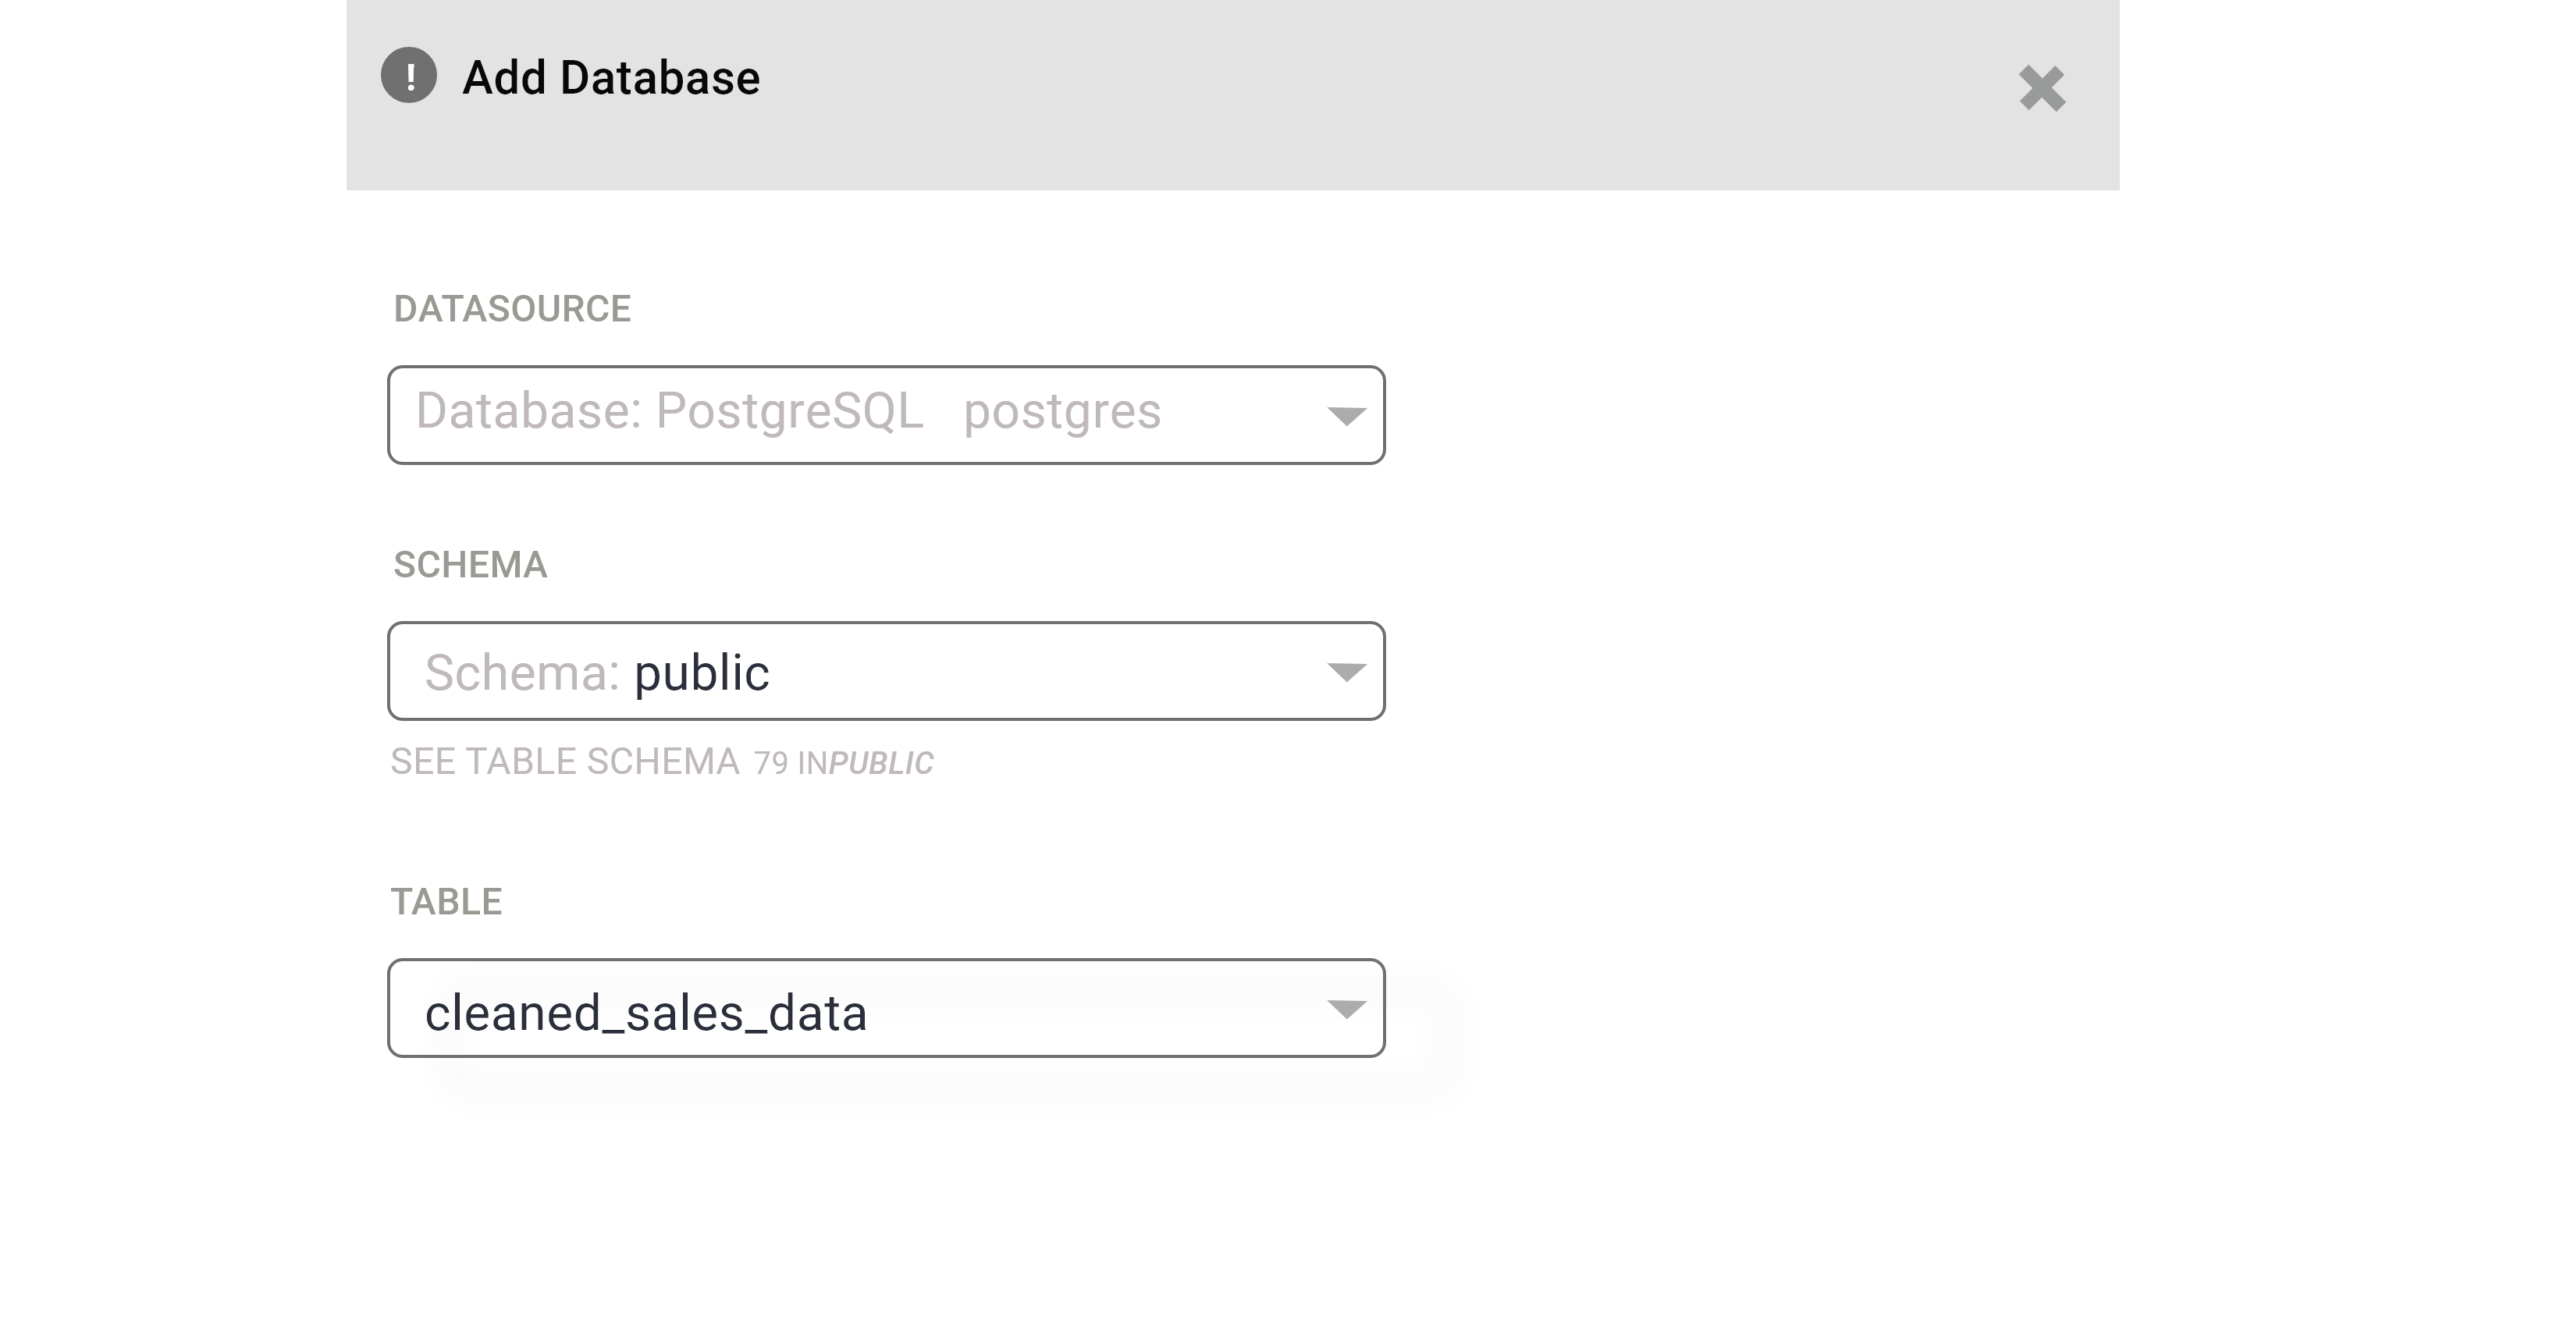
Once you have finished adding a new data source, it is time to choose particular tables that Superset will target for querying. Just go to Data followed by Datasets and in the top right tap on the + Dataset button. Thereafter within the modal window that will appear, you need to select the database, schema, and table from the dropdown menu. Once this is done, just tap on the add button at the right bottom, and you are done. Now you can easily see the desired dataset within the listed datasets.
Creating custom attributes for columns
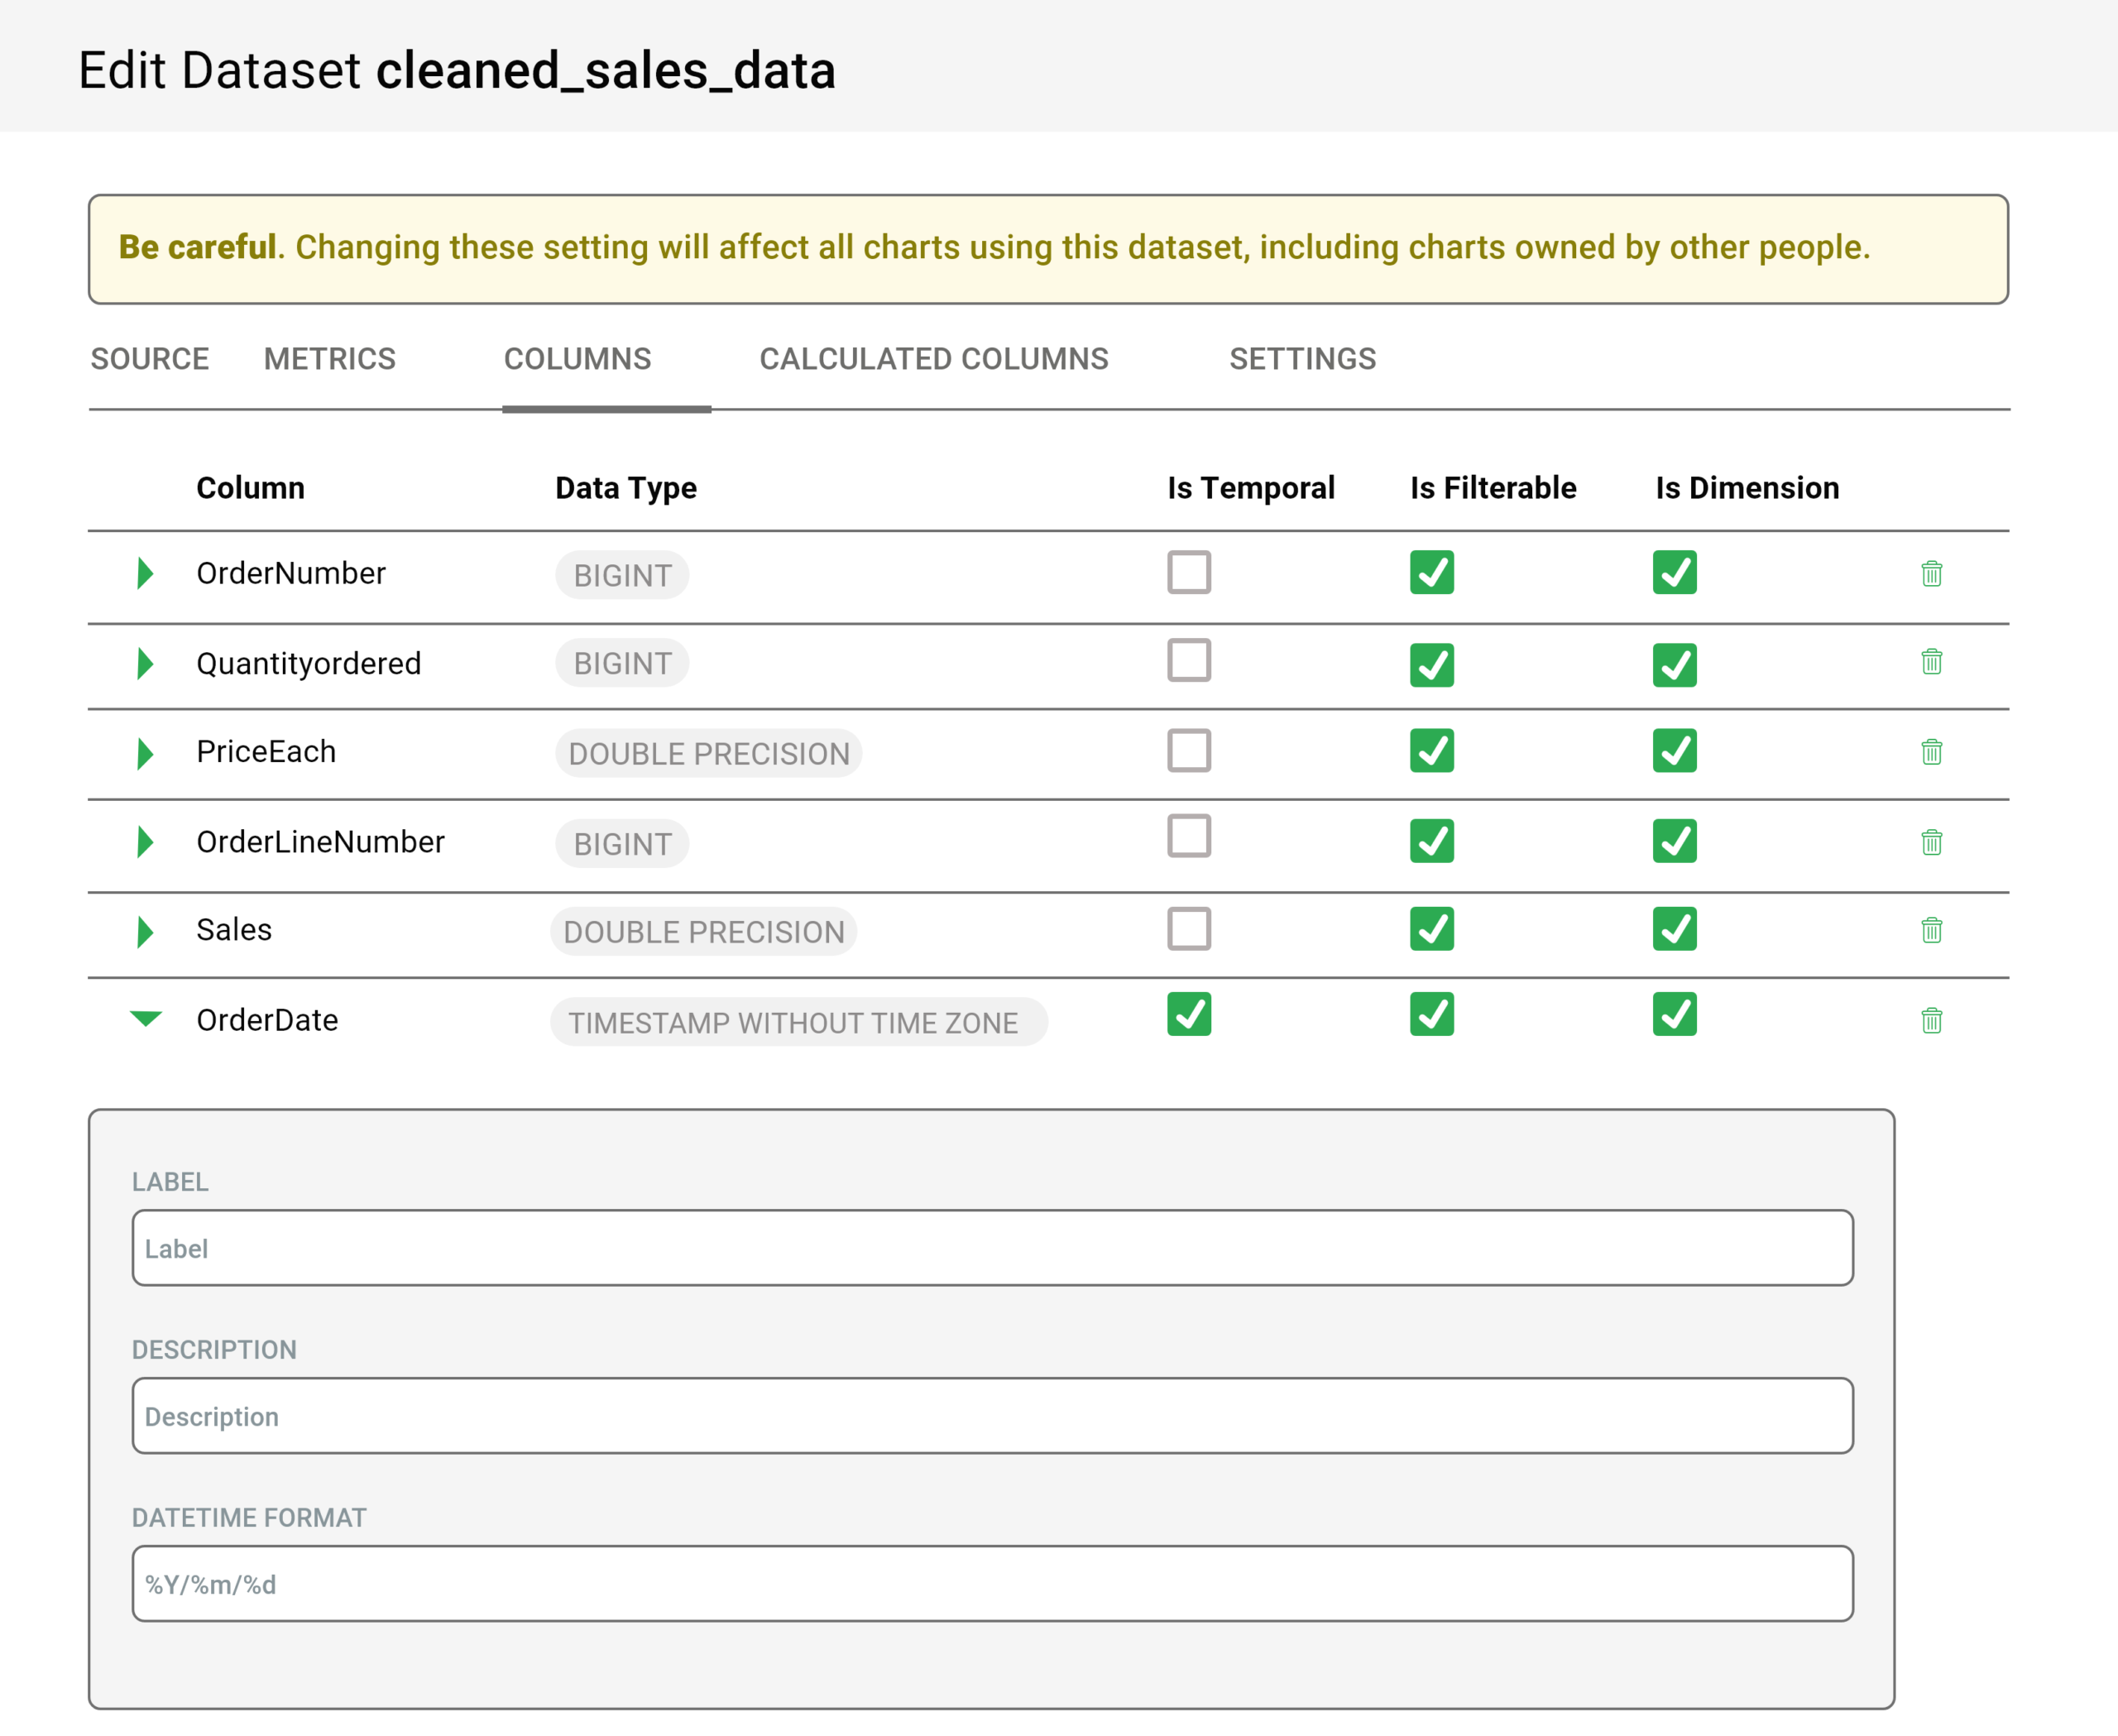
After the dataset is prepared, it is now time for configuring the attributes of every column, and based upon this every column will be treated for exploring the workflow. How every column can be treated depends upon the following considerations.
- Whether the column temporal or not? Can it be used for slicing & dicing within the time series charts?
- Will there be filtering for every column?
- Whether the column is dimensional or not.
- In the case of the date-time column, what date-time format is used by the column?
Adding more value to data through the semantic layer
Superset comes with a semantic layer to add more value to data for analysts. The semantic layer of Apache Superset has two distinct computing abilities. Let’s explain them briefly here below.
- Virtual metrics: This semantic capability is for writing SQL queries to derive aggregate value from several different columns and make them ready for visualization. You can also allow the team to participate by certifying these metrics.
- Virtual calculated columns: This is another semantic capability that allows you to write SQL queries for customizing the way data is presented. For this semantic layer, aggregating data across columns is not permitted.
Building charts in Explore
Though we are going to focus for now only on building charts in Explore, Apache Superset also has the SQL Lab interface. These are the two principal interfaces offered by Apache Superset. While Explore is easy to use visualization builder with no coding requirement, SQL Lab requires creating queries in SQL language for preparing, sanitizing, and connecting data for the Explore workflow.
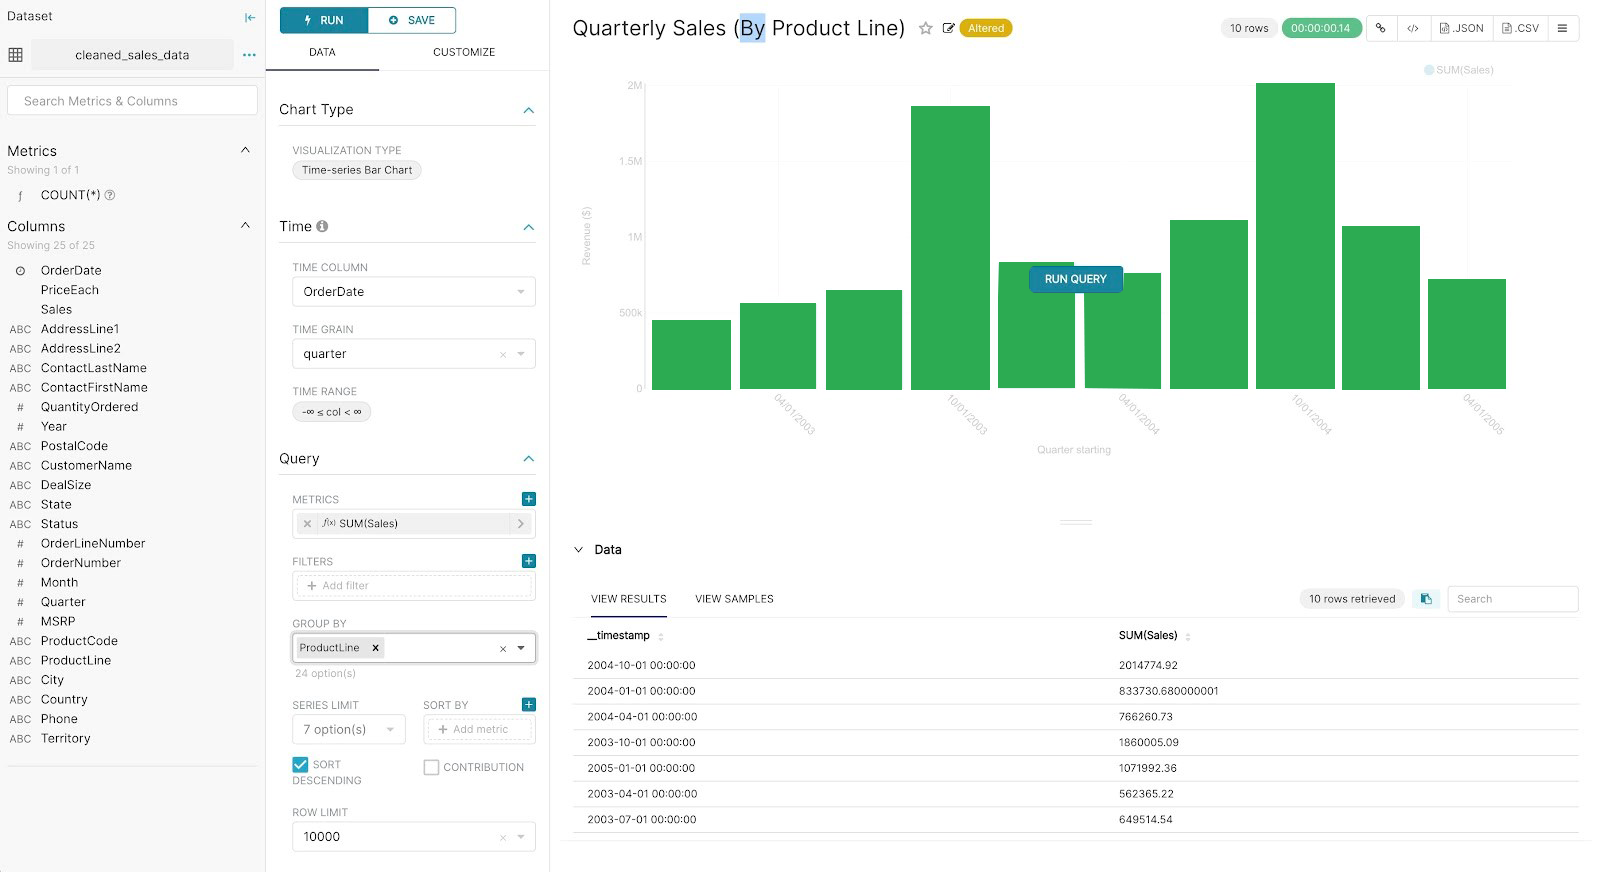
From the Datasets tab, just select the dataset that is going to be used in the chart. Now a well-equipped workflow is ready and you can start iteration to improve the charts.
Just go to the dataset view window and on the left side, you can see several columns and metrics related to the selected dataset. You can also go to the data preview to derive more useful data contexts. Now for changing the type of visualization you can just tap on the Customize tab. After customization is done, always run it to get comprehensive visual feedback.
Let’s create a slice and the dashboard
When you have finished creating the chart, you can save it with a pre-existing dashboard or just a new one. When the chart is ready to publish, just save it and open the dashboard undergoing development.
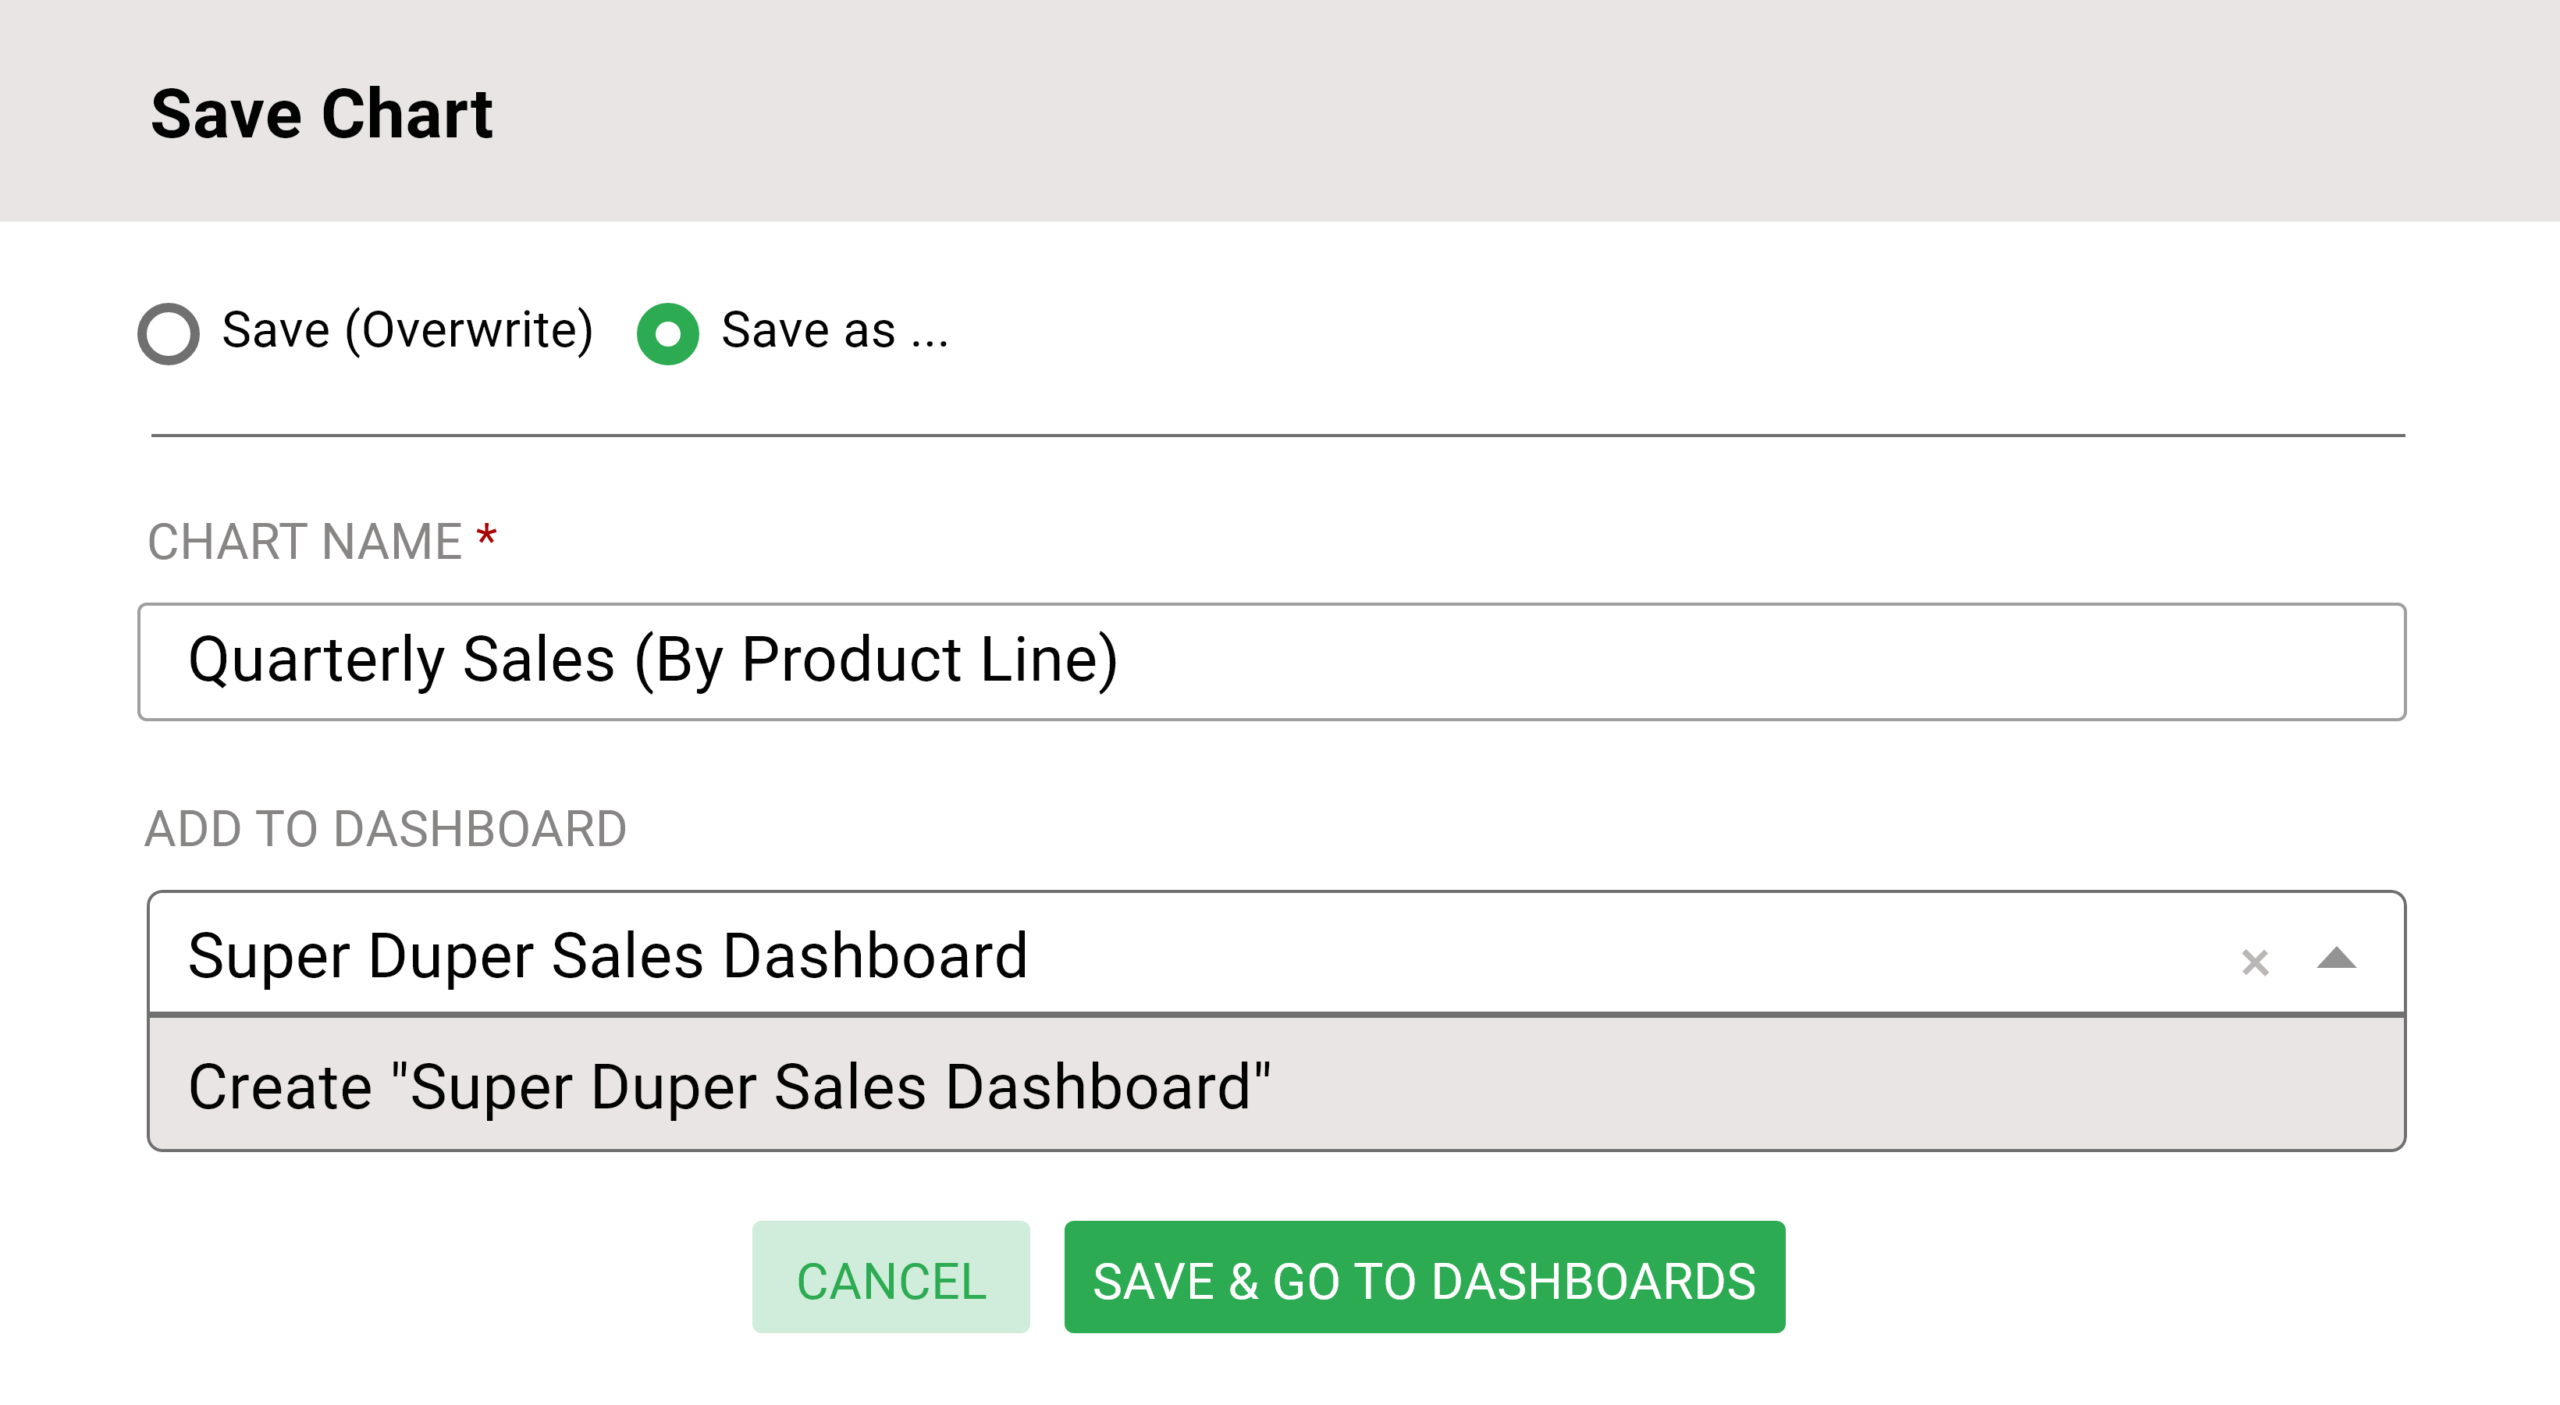
This is when Superset automatically will build a slice and within its data layer will save all the information such as name, type of the chart, options, and the queries. In case you want to resize it, tap on the top-right pencil button and by dragging the border you can resize it as per your need. Don’t forget to tap on the Save button at last.
Thus you have linked the database, created dataset tables, run analysis, and made visualization in Apache Superset. Of course, the above description only covers the most direct and easy configuration option to create your first dashboard. There are tons of other configuration options as well.
Now let’s spare a few words on managing access to dashboards and customizing the dashboards by using simple controls.
Manage access to Dashboards
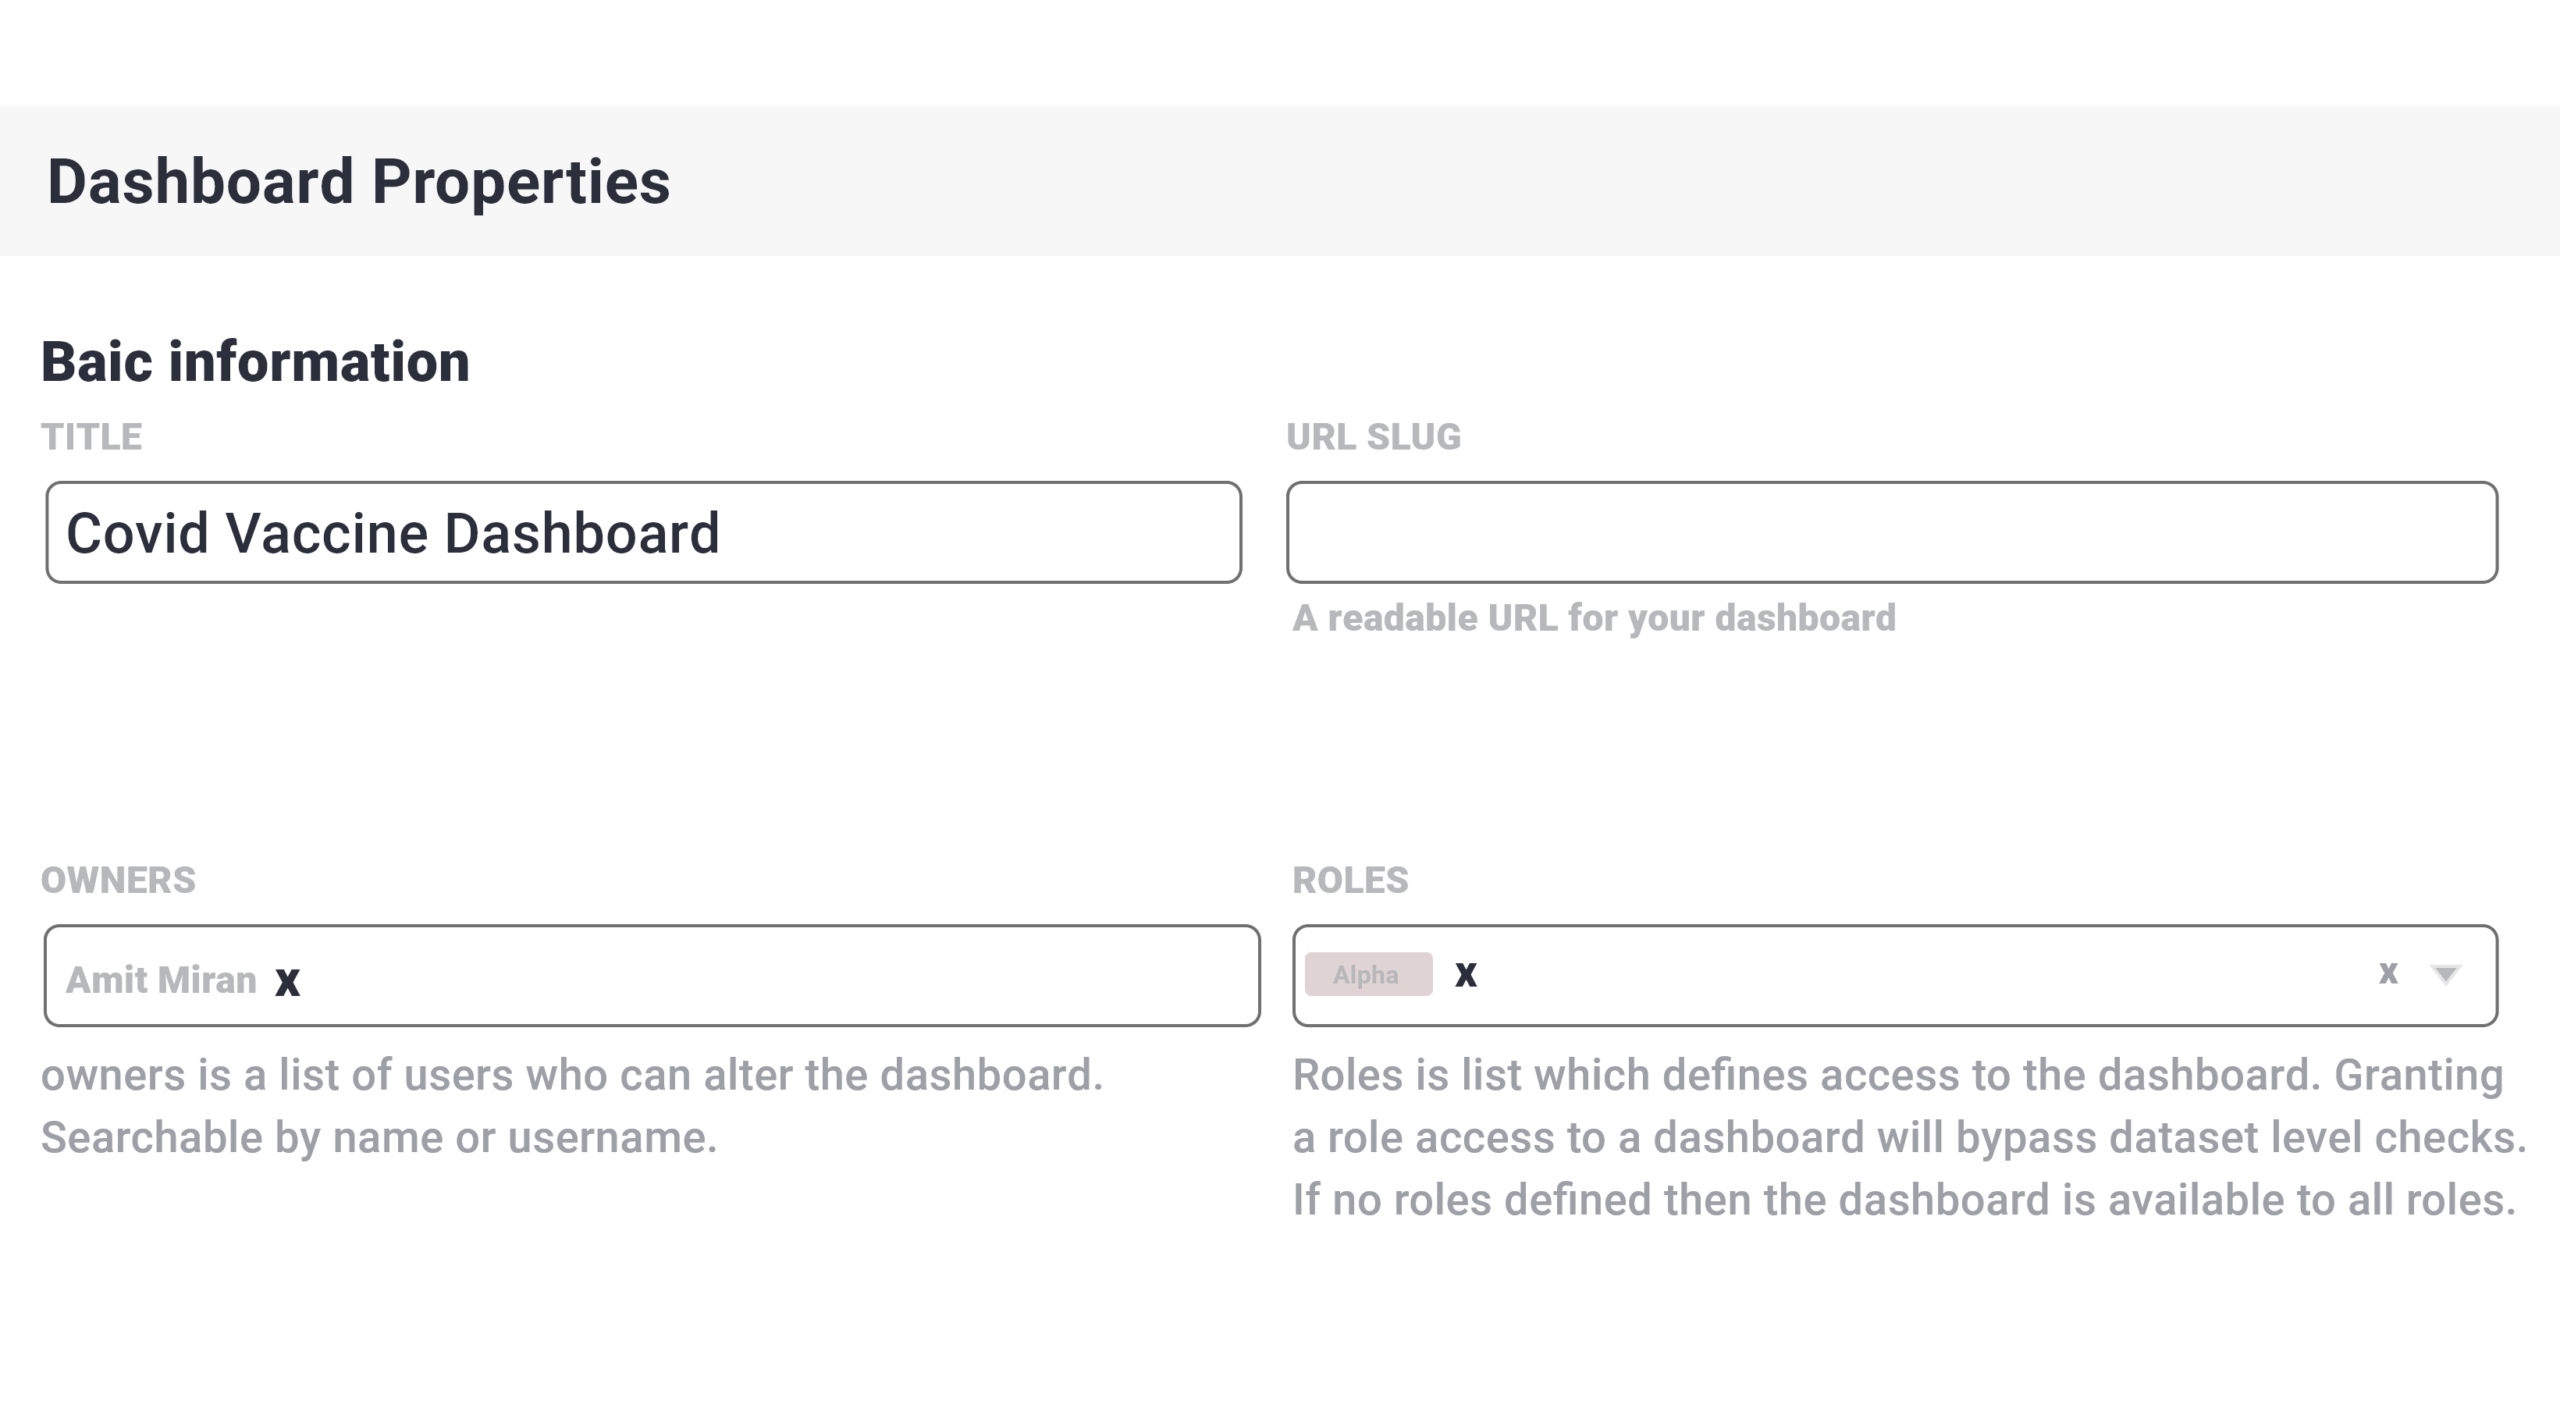
The permission handling for accessing dashboards is taken care of by the owners. The owner controls and manages the access to dashboards by non-users in two distinct ways as mentioned below.
- Access through Dataset permissions: Non-owner users already having permissions to access datasets can automatically access the dashboards that use the same dataset.
- Specific Dashboard roles: The owner can also use the DASHBOARD_RBAC flag to allow preferred roles with permission to access the dashboard.
Customizing the dashboard
After all, customization of data visuals is what Superset is widely known for. For customizing the rendering of the dashboard several different URL parameters can be used.
For standalone Dashboard
- The first or default option is when the dashboard appears normally.
- You can customize the normal view by hiding the top navigation
- You can further customize by hiding the top navigation along with the title
- For customizing further you can hide the top navigation and title along with the top layer tabs.
Customizing the filters
- You can render the dashboard with no Filter Bar
- You can only render the Dashboard with a filter bar with native filters.
- You can expand the filter bar and render the dashboard with an expanded or collapsed filter bar.
On A Final Note
Apache Superset is the answer to all the difficulties experienced in creating and rendering intelligent dashboards and visualizations. With a little learning curve, it allows people with no programming background to utilize the power of data visualizations for business intelligence.

