Blogs
Creating big Data Intensive application using Sencha Ext JS 6.5 Modern toolkit
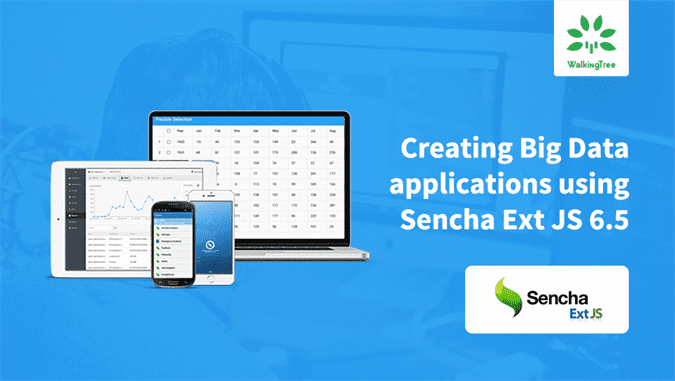
 Sites like AirBnB, MakeMyTrip, IPLT20, NFL, Bloomberg are heavy on data and presentation. Such applications require a scalable UI framework that is flexible and efficient in data loading, provides different data integration strategies, allows reusing the client-side data for different presentations, offers rich user interaction and drives behaviour across different sections of the application. The new release of Sencha Ext JS 6.5 framework has made significant enhancements to Modern toolkit. This article describes Sencha Ext JS 6.5 Modern toolkit features that you can use to build a scalable data-intensive application.
Before we start, let us look at few data intensive applications to understand what could be required from a UI framework
The features that are common to these applications are:
- High quality widgets that can allow construction of views
- Composition of application using widgets and custom layouts
- Effective client-side data management including sharing data across widgets
- Theming to brand widgets and application
- Capability to curate data from same or different domains
- Speed
Let us look into the Modern toolkit features that map to one or more points listed above.
Grid
Grid has got lots of enhancements in Ext JS 6.5 Modern toolkit for an obvious reason that it is one of the most widely used components. While there are still features in Classic that are not present in Modern, but following features shall take care of most of the uses cases: Grouping, group summary, cell editing, widget cell, editable grid (with form based editing), grid tools, header tools, context menu, pagination, row body, row expander, row/cell/column selections, summary row grid, view options to control what columns need to be shown and their order, nested columns, styling, widgets, sorting & filtering, and exporter.
Here is an example grid depicting various features:
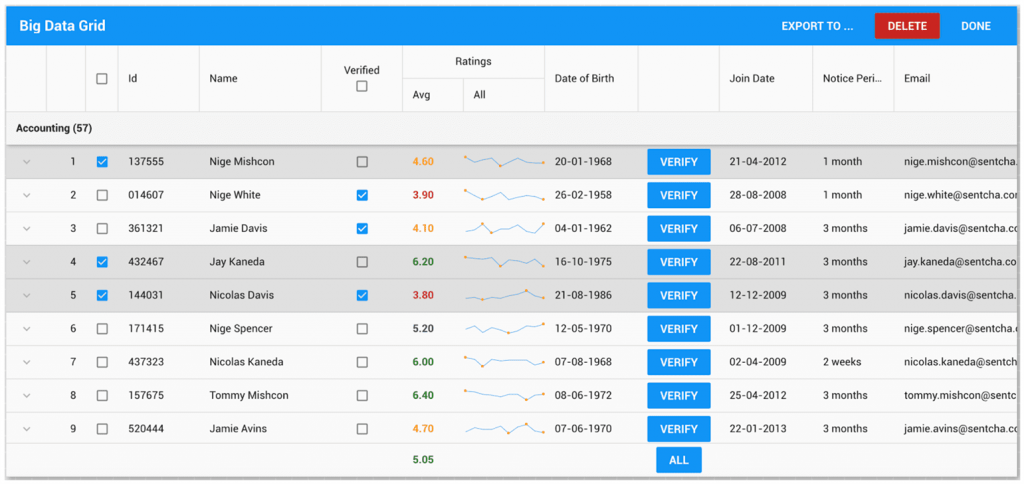 Courtesy: Sencha Ext JS 6.5 Modern toolkit examples
Pivot Grid
Pivot grid lets you quickly summarize large data set in a format that makes it easier for the users to understand trends and gain insights. With features like different layouts – outline, compact, and tabular, capability to allow user to configure a grid using configurator, drill-down to understand more about the summarized data, and options to locally or remotely carry out the calculations make it suitable for use case like Quarter-wise Sales, Customer-wise Orders, etc. where the user can start with a summarized view and expand rows/columns to get more detail (say, month-wise sales for a quarter).
The new tabular layout is the implementation of MS Excel Tabular Form layout, which displays one column per field and provides space for field headers, as shown below:
With Exporter you can export the complete Pivot Grid in different formats – Excel (xlsx & XML), TSV, CSV, HTML and allow further analysis with tools like MS Excel. With new enhancement, you can now export the pivot definition, as well. This is very handy with MS Excel as the exported file is ready for pivot analysis with Excel.
Charts
Charts have been there in Modern toolkit since the birth of the toolkit. With different types of charts, drawing capability, and gestures, you can build stunning visuals based on the data. You can use the new Navigator component to let your users visually manage the visible range for the X-axis of a cartesian chart. This is widely used in FinTech but is equally useful in other industries, as well. In addition to this, a BoxPlot series is available for you to use.
D3 Visualization
You can use Sencha Ext JS D3 adaptor to build D3 visualizations and back them with data package. It abstracts SVG and D3 API complexities and provides clean and consistent interface to visualize your data. With different hierarchies such as tree, org chart, treemap, pack, words, and sunburst, and heatmaps such as basic, pivot, configurable pivot – you have all the power of D3 integrated very well with the rest of the Ext JS application.
Data View
Data view is a useful component when you have to create custom view/presentation based on data. You can configure a HTML template with data fields as placeholders. The component takes care of generating final DOM elements using the template and data and renders it on the screen. Also, when the data changes, the component refreshes the view, automatically.

Courtesy: Sencha Ext JS 6.5 Modern toolkit examples
List
List is an extension of Data View and is very similar to a contact list that you see on your smartphone. You can create simple, nested or grouped lists using this component. In case it has to deal with large data set, you use Pull Refresh or List Paging options. And, with the new accordion/step swipers, you can offer quick actions on list item when the user swipes a list item to left or right. Here is an example depicting a list with swiper:
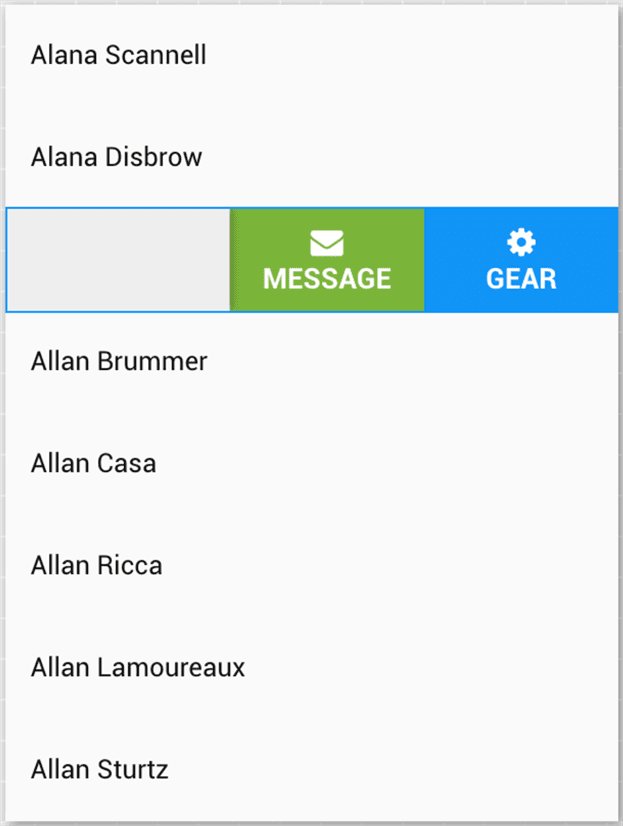
Courtesy: Sencha Ext JS 6.5 Modern toolkit examples
A list accepts a template that you can configure to fully customize what detail needs to be shown for each list item and how they shall be styled.
Data Package
Data package of Sencha Ext JS Modern toolkit is the most important package – besides UI components – that you will need to achieve the following:
- Connect with different type of data sources – Ajax, REST, SOAP, AMF, oData, Direct, In-memory, and more.
- Process different type of payloads and deserialize as JavaScript objects – JSON, XML
- Validate incoming data
- Transform incoming data and make it suitable for UI
- Transform outgoing data and make it suitable for remote service
- Optimize payload by reading related data in same network request
The Proxy, Model and Store are the main classes of this package. There are different proxies and stores available to take care of the different use cases and you can always implement your own, if needed. A new store – Virtual – has been introduced in 6.5 Modern toolkit, which is more intelligent than the Buffered store when it comes to pre-fetching and caching records for smooth scrolling experience to users when they are working with large data set using components like List, Grid, Dataview, etc.
Data Binding
ViewModel powers Data binding. Using these two, you can achieve a lot of application functionality with declarative style making it easier to maintain separation of concerns. You can link the behaviour of different components and modify component state and/or data by binding them with the view model data. And, the UI components refresh their view, automatically, as soon as the bound data changes.
Layouts
Layouts – such as, hbox, vbox, center, etc. – let you control how the content shall be laid out on the screen. This decision is taken by a layout configured on a container. Based on a layout used, it decides how the child items shall be displayed and aligned inside the container. With the combination of Container, Layout, and Component, you can practically create any application structure/layout.
User Interaction
For engaging user experience you require the components to offer you a wide variety of events so that you can figure out how user is interacting with your application. More fine grained events you have better user interaction you can build. All the Sencha components fire various events to help you build interactions. E.g. grid can tell you if the user has selected a cell or a column or the user has right clicked on a row, etc. Using the listeners config or the on/mon API you can register event handlers and respond to such interactions.
Speed
While the framework offers all the client-side capabilities to build data intensive application, the overall speed at which data flows between remote service and UI is also an important concern. Thanks to the Data package, you can completely decouple your UI components from data sources and how data is being fed to the components. This allows you to integrate your UI with solutions like Hazlecast, Redis, Speedment, and more to accelerate data loading experience by manifold.
Summary
With full client-side data management, data connectors, rich themable components, complex layouts – Ext JS 6.5 Modern toolkit offers complete capabilities to build data intensive applications. You can create any kind of complex data driven application to offer rich trends, improve insights and speed up accurate decision making.
We love to hear what you are planning on building. Feel free to contact us with your questions.
Here is a sample Market Watch application created in Ext JS 6.5 Modern toolkit:
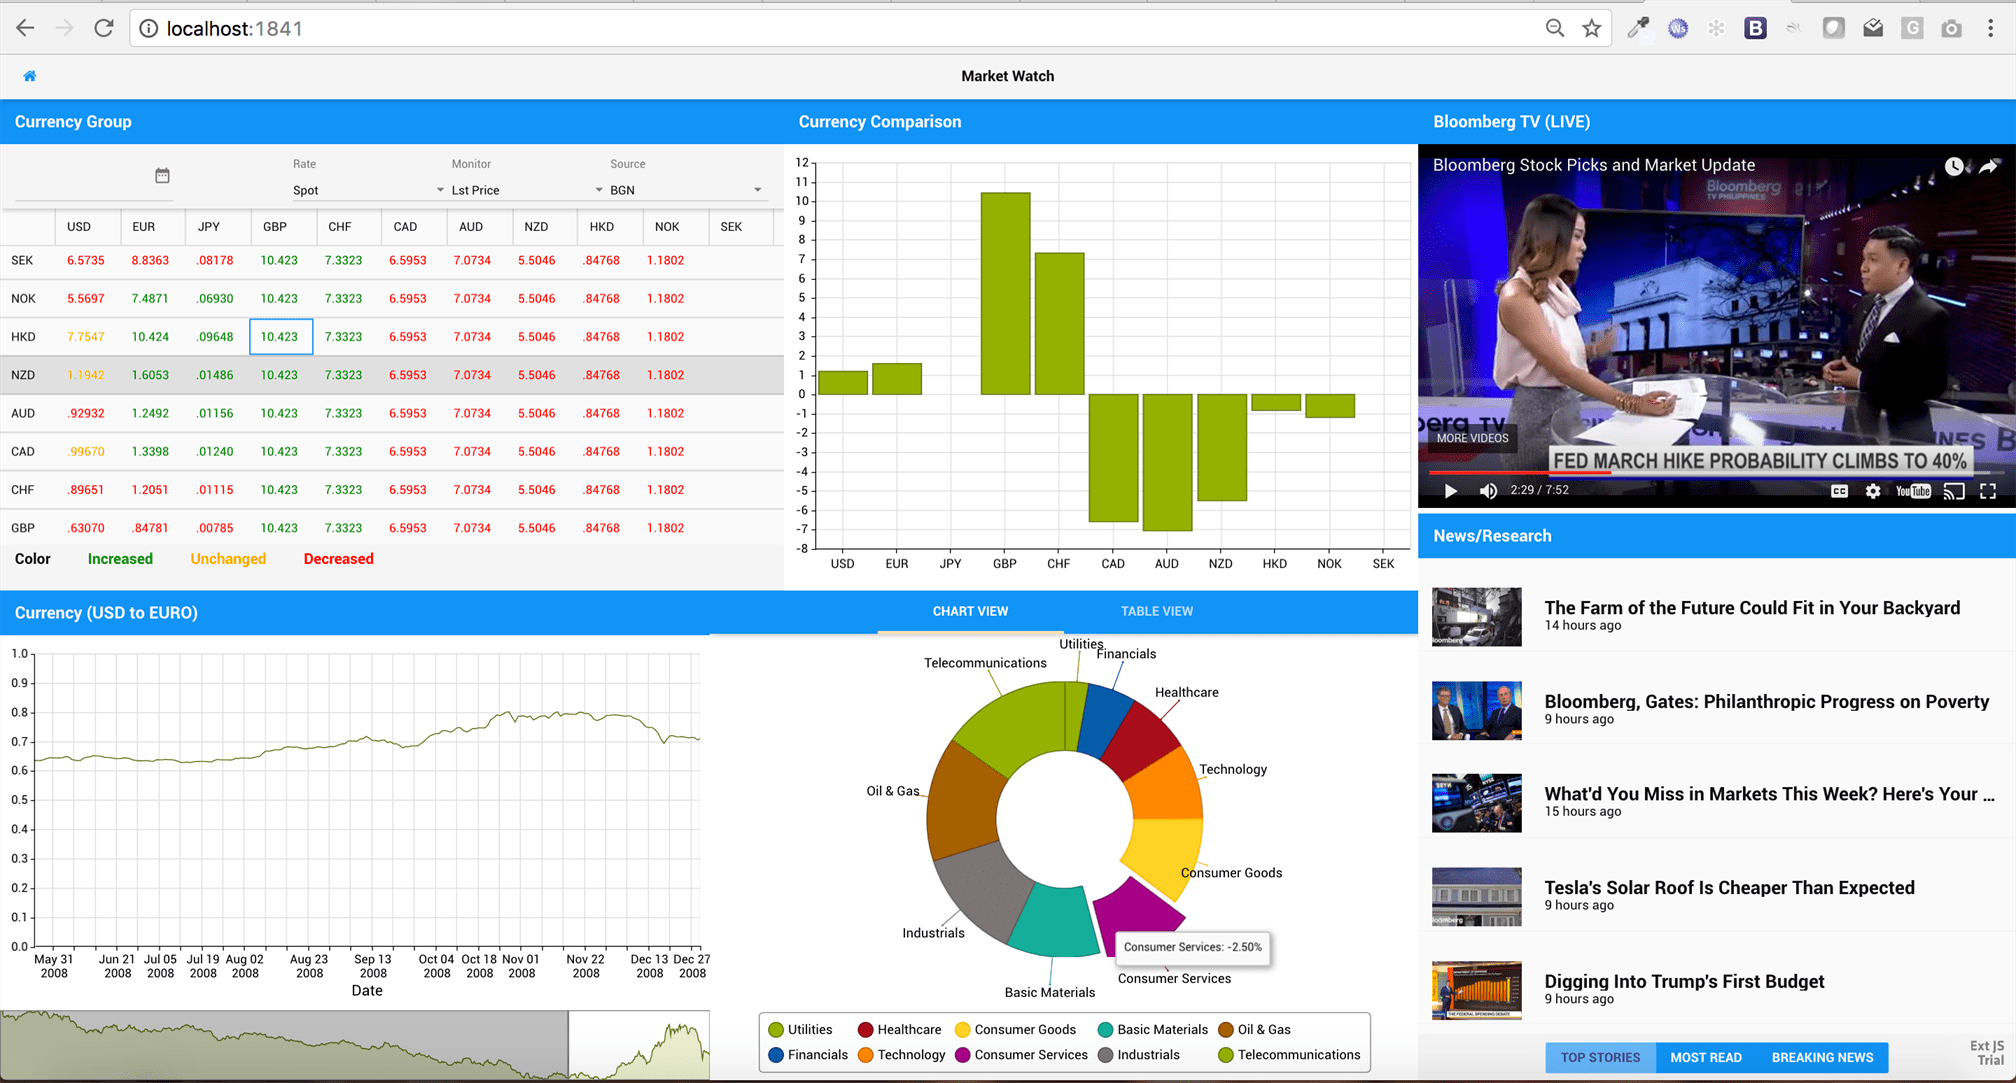
In case you are wondering how can I create a universal application that can work on Desktop, Tablet, and Phone, you must read Creating Universal application using Sencha Ext JS 6.5 Modern toolkit article.
What’s Next?
- Webinar recording
- SenchaTutorials
- Try Ext JS 6.5 components and features
- Explore Ext JS API docs
- Read about Sencha Ext JS


