

Blogs
How to obtain app performance & why it’s critical?

Despite many controversies over privacy, fake news, hacking and all the other negative aspects of online life, the world perpetuates to hold a grip on internet and web/mobile applications.
The usage of web/mobile application is rapidly increasing & the ratio of internet users is seamlessly progressing without a full stop. This growth clearly defines the usage of the application in the digital world.
Current Situation
According to a recent statistic, 57% of the global population is active internet users, out of which 42% are using mobile to surf the internet, and on an average, the world’s internet users spend a minimum of 8 hours on web/mobile each day. But, why do users spend 8 hours each day on the web or mobile applications? What are the prevalent issues that user encounter while surfing?
Problem Statement
In this blog, we aim to highlight the top issue (Load Time) of web-mobile application users while browsing.
Load time – Mobile Application Load time has been the top issue for the users & statistically, 53% of mobile site visits are forsook if a page takes longer than 3 seconds to load. But in reality, 70% of sites take longer than 10 seconds to load on 3G networks, especially on mobile networks. Load time is engendering a gap between user and application, so there is a great desideratum for performance.
Notable Solutions
In this digital world, most of the application codes are indited in JavaScript. With shipping bytes and bytes of JavaScript, monitor the JavaScript to achieve a great performance that can decrease Application load time and increase the webpage haste.
Here are a few tips of Javascript for performance optimization. Before stepping into the optimization, one has to understand the measure performance of an application. Set a goal to measure the performance and provide a better user experience. A developer has to spend more time on the application to create a better, smoother, faster, and convenient user experience. User satisfaction is directly cognate to what a developer watches on the screen, i.e. application loading time.
To capture application loading time, use Google’s performance extension. It churns the precise result, but sometimes load time slows down due to memory leaks.
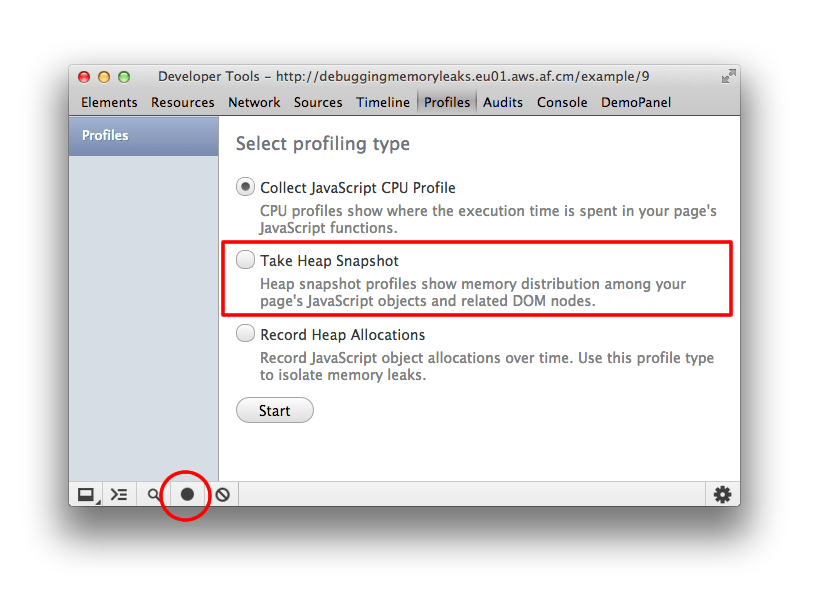
Google’s memory extension avails in finding where the problem originates, the Memory section in Chrome DevTools comes in handy. Follow the steps mentioned below to identify the exact source of a memory leak.
-
- Open Memory section in Chrome DevTools
- Reload the page
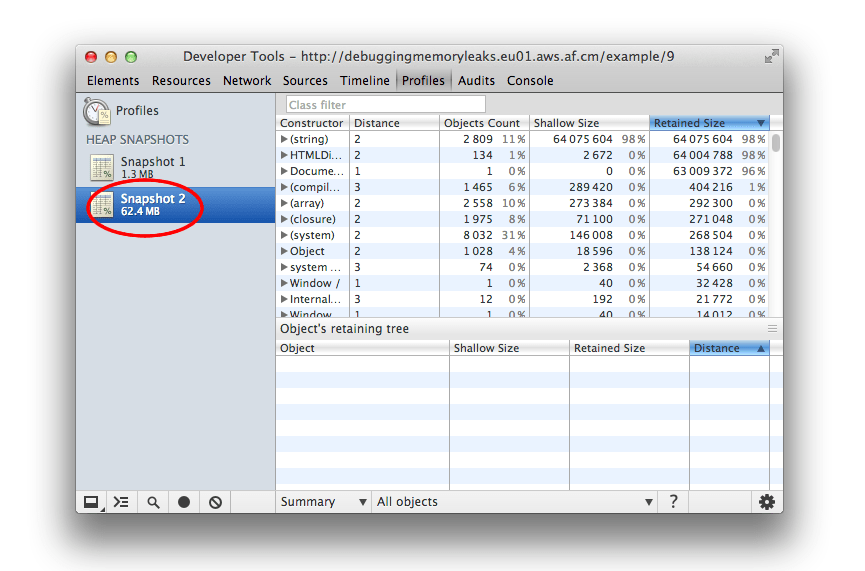
- Take a heap snapshot
-
- Perform task (opening page/ clicking button etc)
- Take another heap snapshot
-
-
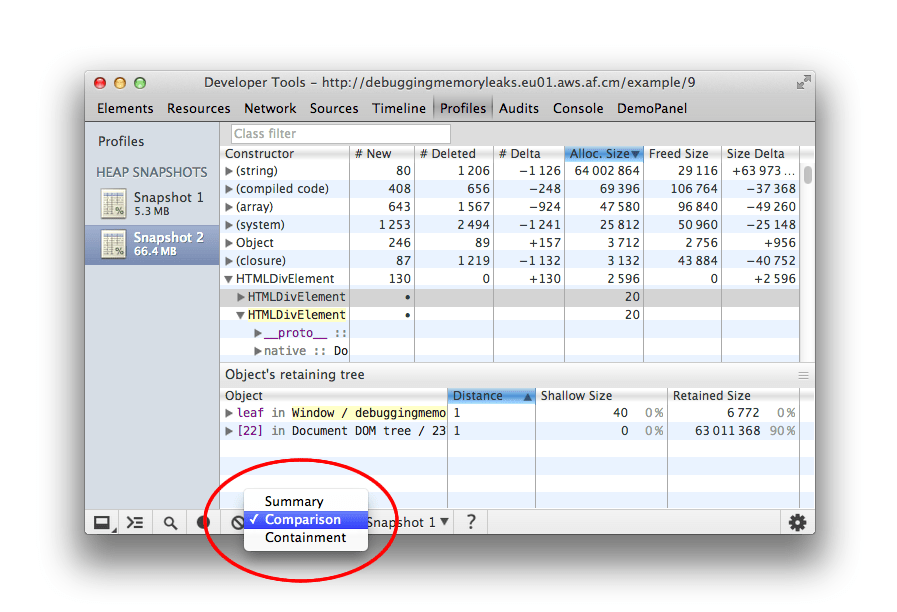
- Compare the two snapshots and you’ll see the second one uses more memory although we have removed all tasks.
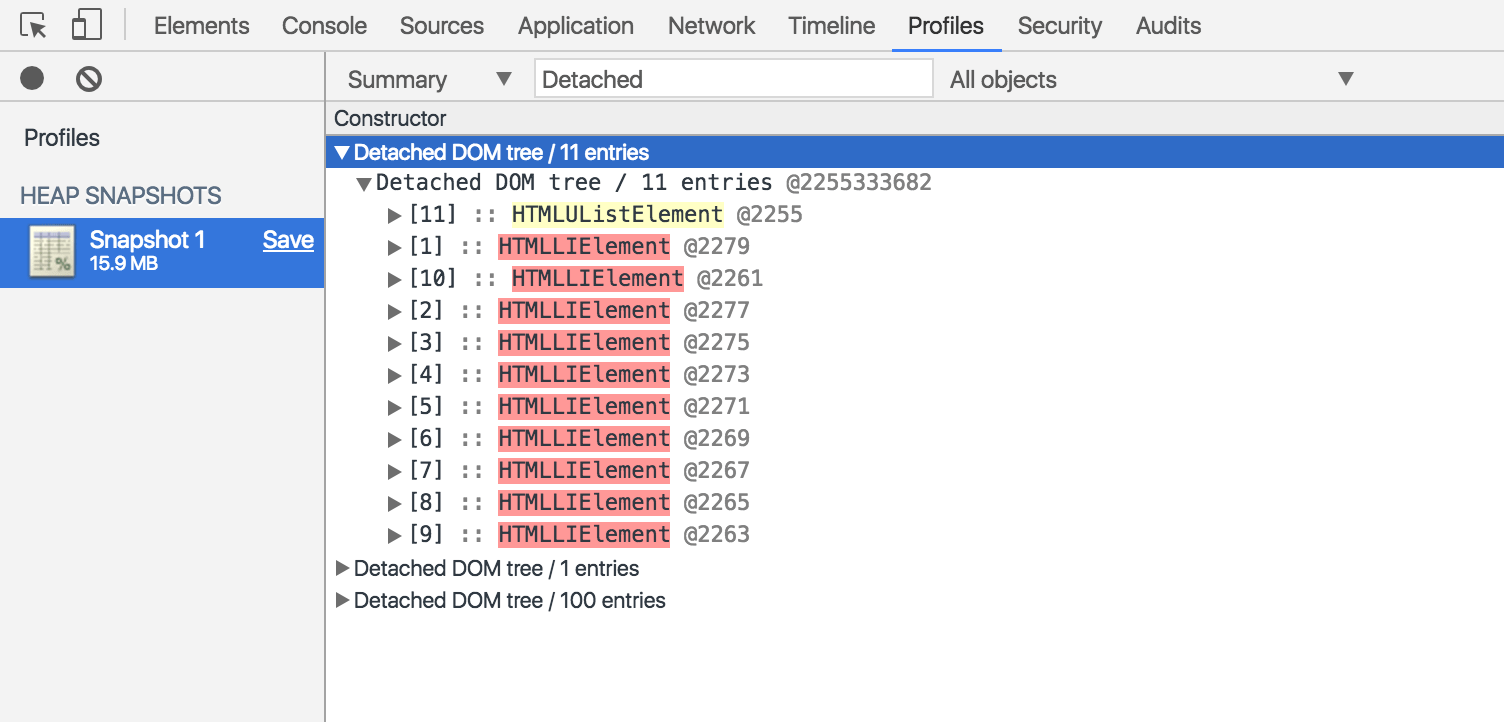
- Expand the “Detached DOM tree” list and you will see there are still references to the DOM elements that were removed (marked in red)
-
Conclusion
Delighting a customer is a top priority for any developer or a company. Application load time has been creating hurdles in achieving user satisfaction. Fortunately, by using Google Chrome Devtools Extension, a developer can add more value to JavaScipt codes and can easily delight a user.