


Blogs
Sencha Ext JS 5 Charts Architecture
Overview
With the launch of Ext JS 5.0, direction on Charts is to move from their legacy Ext JS Charts to the newer and more powerful Sencha Charts package. While the support for Ext JS Charts continues, it would be deprecated, and eventually replaced, by Sencha Charts. Sencha Charts comes from Sencha Touch and has built-in support for touch, which means you can use touch gestures to interact with the charts. Sencha Charts renders charts as SVG or HTML5 Canvas or VML in IE8. You may refer to Ext JS 5 Charts Kitchen Sink to test drive and learn more about charts.
Charts is an essential part of any enterprise solution offering as it gives a quick overview of different KPIs and helps in effective and efficient decision making. While Sencha Charts comes with various built-in charts that can get us started with the data visualisation, to make a perfect decision making solution for your customer, you may need to look-and-go beyond them. And, when you have to do that, it is critically important that one understand the extensibility capabilities that Sencha Charts package offers in terms of customising an existing chart, extending an existing chart, and, finally, creating a new custom chart.
In this article, we would dive deep into the Sencha Charts architecture to understand the classes involved in offering the capabilities and their interaction.
Sencha Charts Architecture
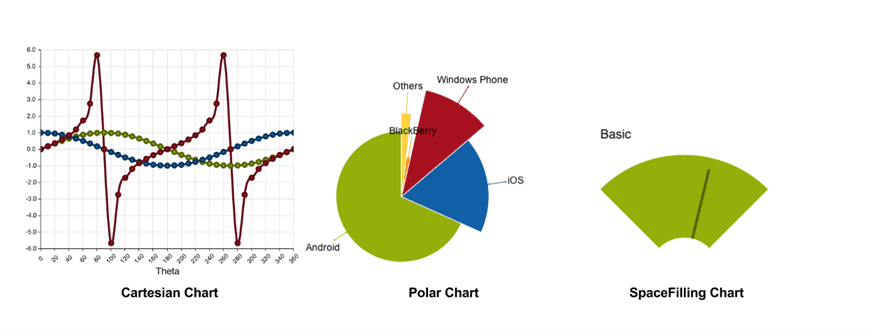
Sencha Charts supports three types of charts:
- Cartesian Chart – works with cartesian coordinate system where we work with X-Y axis
- Polar Chart – works with polar coordinate system where we work with angular axis (circle) and radial axis (towards radius)
- Space Filling Chart – creates a chart that fills the complete area of the charts
The below screenshot shows an example of each type of chart:
Sencha Charts package implements the different type of charts using the following important classes:
- Chart – Ext.chart.AbstractChart class implements the different type of chart. It manages the common features across different type of charts & series, such as, axis, legend, theme, grid, interaction, and event. It relays the events originating from series.
- Series – Ext.chart.series.Series is the base class for bar, column, line, area, etc. series. It uses sprites to draw the visual output and offers tooltip and events.
- Sprite – Ext.draw.sprite.Sprite is used to draw different shapes, such as, rectangle, ellipse, path, text, image, etc. It offers the basic building block to render series. It has the support for gradient and modifier like item highlighter.
- Draw – Ext.draw.Container is the main container on which the chart is rendered. On this draw container a surface is rendered. It also provides the functionality to download a chart as an image or PDF.
- Surface – A chart is divided into various layer of surfaces, which are implemented by Ext.draw.Surface. Each layer takes care of rendering a specific information using SVG/Canvas engine.
- Engine – Engine is the lowest level class in the Sencha Charts stack which encapsulates the differences between HTML5 Canvas and SVG APIs and provides a common API to the surface class.
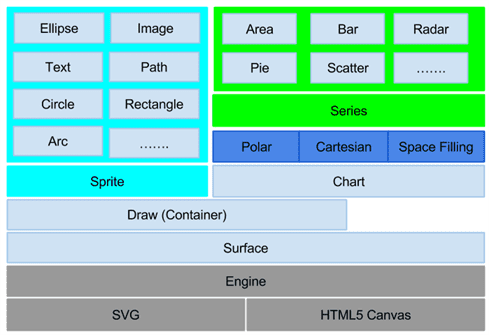
In the above diagram, we have depicted the most common and high-level classes that are used to create charts in a Sencha application. There are few more useful classes that are worth knowing when we intend to create custom charts.
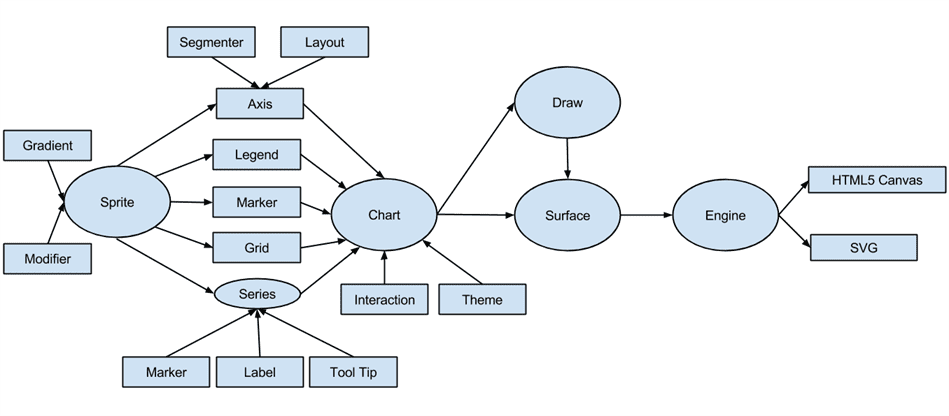
- Axis – Ext.chart.axis.Axis is responsible for rendering the chart axis. There are three types of axis classes – Numeric, Category, and Time – offered by Sencha Charts.
- Legend – Ext.chart.Legend class takes care of showing the chart legends at the specified position.
- Markers – Ext.chart.Markers – Axis uses this to draw the grid and limit (threshold) lines. Markers are also used to render series items like bars and objects (e.g. circles) at each data point.
- Grid – Ext.chart.grid.* – Axis uses the class to draw grid lines.
- Interaction – Ext.chart.interactions.Abstract – Base class for interactions like PanZoom.
- Theme – Ext.chart.theme.Theme – This class is responsible for theming a chart, which includes creating custom theme for the axis line, label, series, etc.
The below diagram shows the various classes of the chart stack and their interaction:
As discussed earlier, a chart is divided into various layers of surfaces and each surface is used to render a special content. The layering is controlled using z-indices. The below diagram shows the different layers, their z-index orders, and what gets rendered:
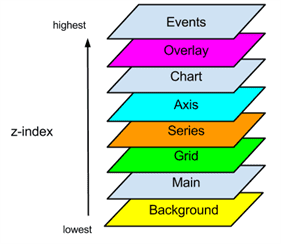
E.g. grid lines are rendered on the Grid surface whereas bars (in a bar series) are rendered on the Series surface.
Summary
We saw how Ext JS Charts (legacy) is different from Sencha Charts and its main constituents. We learnt how the different classes interact with each other to construct and render different type of charts that Sencha Charts offers. We also highlighted the classes that are primarily responsible for a sub-set of overall chart functionality and those classes are the candidates for override and extension when we would discuss about creating a custom chart. Hope this would have given you an insight into the overall architecture of Sencha Charts, which shall act as a reference when you need to implement a new chart – a cartesian or a polar or a space-filling.
References
- Ext JS Charts Kitchen Sink
- Sencha Charts Kitchen Sink
- Sencha Ext JS 5.0.0 Docs
- Sencha Ext JS 5.0.0 API Documentation
- Ext Charts Upgrade Guide
- HTML5 Canvas Tutorial
- Dive into HTML5 Canvas
- Scalable Vector Graphics


Really it’s great one,after reading this post,have depth knowledge in charts.
Thanks