


Blogs
Handling Label Collision in D3 Quadrant Chart using v4 API
Problem Statement
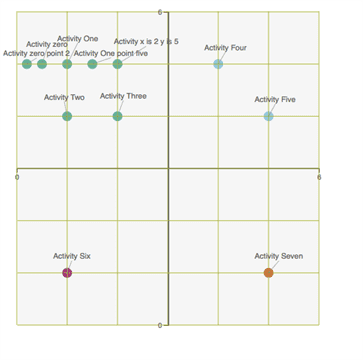
While working with quadrant chart using D3 V4 in one of the angular application, I faced a challenge where the nodes label of the chart were colliding/overlapping when nodes were closer. Basically I was constructing a quadrant chart where I was trying to show the activities on X and Y axis (say from 0 to 6). I constructed this quadrant chart with the D3 library of version V4 and the Chart looked like below
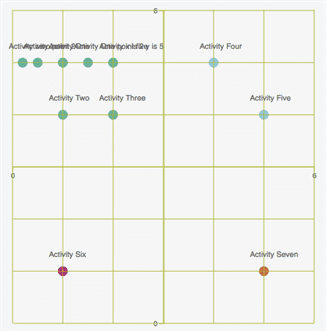 In the above chart, all the activities in 1st Quadrant are very close and their labels are little bigger so some of them overlapped, which was not readable. In this article, I’ll explain to you how did I construct the Quadrant Chart with the D3 V4 library in Angular 2 application and fixed the label overlapping issue with forceSimulation API of D3 V4.
D3-Force Module
D3 V4 has got d3-force module using which we can solve the overlapping of labels issue. In simple words, d3-force modules apply certain algorithm to apply certain force between the nodes to make sure node positions have moved enough distance to avoid overlapping. For more details, you can go through the d3-force module documentation.
Pre-Requisites
- Node 6.9.0 or higher
- NPM 3 or higher
- angular/cli, install the latest version globally (follow the steps here)
Steps to construct D3 Quadrant Chart in Angular2 Application
Let us follow the below steps to create a new Angular2 application and create quadrant chart using D3 V4.
Create new angular 2 application
Let us create new anglur2 project with name d3quadrant by running below command in the project directory
ng new d3quadrant
Above command created a project with below folder structure:
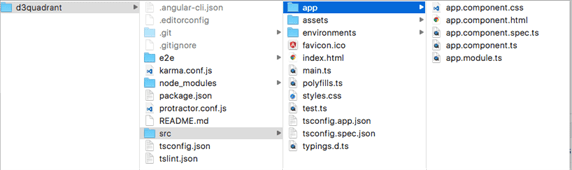 We will make changes to the app component in which we will build quadrant chart using D3.
Add D3 V4 library to the Project
D3 is written using ES2015 modules. To import D3 into angular 2 application, either import specific symbols from specific D3 modules
import {scaleLinear} from "d3-scale";
Or import everything into a namespace (here, d3):
import * as d3 from "d3";
Build Quadrant Chart, In the app component of the newly generated project.
- Add SVG element to the app.component.html file
<svg id="scatter" width="500" height="500"></svg>
- Let us create X and Y axis in ngAfterViewInit function of the component using d3.scaleLinear API
var x= d3.scaleLinear() .domain(padExtent([1,5], undefine)) .range(padExtent([0, domainwidth], undefined)); var y = d3.scaleLinear() .domain(padExtent([1,5], undefine)) .range(padExtent([0, domainheight], undefined)); - Append the rect to the SVG element defined in component HTML, adding certain margin. Under this rect element, we will add axis(s), circle and text (labels)
g.append("rect") .attr("width",width - margin.left - margin.right) .attr("height",height - margin.top - margin.bottom) .attr("fill","#F6F^F^"); - Append ticks to the X and Y axis and add grid lines for the ticks
g.append("g") .attr("class", "x axis") .attr("transform", "translate(0," + y.range()[0] / 2 + ")").call(d3.axisBottom(x).ticks(5) .tickFormat(function (v) { return (v === 0 || v === 6) ? v : ""; })); d3.selectAll("g.x.axis g.tick") .append("line") .classed("grid-line", true) .attr("x1", 0) .attr("y1", (y.range()[0] / 2)) .attr("x2", 0) .attr("y2", -(y.range()[0] / 2)); g.append("g") .attr("class", "y axis") .attr("transform", "translate(" + x.range()[1] / 2 + ", 0)") .call(d3.axisLeft(y).ticks(5).tickFormat(function (v) { return (v === 0 || v === 6) ? v : ""; })); d3.selectAll("g.y.axis g.tick") .append("line") .classed("grid-line", true) .attr("x1", -(x.range()[1] / 2)) .attr("y1", 0) .attr("x2", (x.range()[1] / 2)) .attr("y2", 0); - Create dummy data in an array and assign array to the data variable in the function
- Create the circle’s for each node in the data. While creating circle prepare lable_array, which will have nodes to create labels for the circles created and create onFocus and onFocusLost functions to highlight and unhighlight the circle respectively, which will be called when mouseover and mouseout events occur on the label’s created.
g.selectAll("circle") .data(data) .enter().append("circle") .attr("class", "dot") .attr("r", 7) .attr("cx", function (d) { return x(d.consequence); }) .attr("cy", function (d) { return y(d.value); }) .style("fill", function (d) { if (d.value >= 3 && d.consequence <= 3) { return"#60B19C" } // Top Left elseif (d.value >= 3 && d.consequence >= 3) { return"#8EC9DC" } // Top Right elseif (d.value <= 3 && d.consequence >= 3) { return"#D06B47" } // Bottom Left else { return"#A72D73" } //Bottom Right }).attr("id", function (d) { varid = "point" + d.question.replace(/ /g, "_"); id = id.replace(/\//g, "-"); varpoint = { x:x(d.consequence), y:y(d.value) } varonFocus = function () { d3.select("#" + id) .attr("stroke", "blue") .attr("stroke-width", "2"); }; varonFocusLost = function () { d3.select("#" + id) .attr("stroke", "none") .attr("stroke-width", "0"); }; label_array.push({ x:point.x, y:point.y, name:d.question, width:0.0, height:0.0, onFocus:onFocus, onFocusLost:onFocusLost, id:id }); return id; }); - Create label’s with the label_array defined while creating circles, and call onFocus and onFocusLost functions on the element on mouse-over and mouseout events on label.
var labels = svg.selectAll(".label")
.data(label_array)
.enter()
.append("text")
.attr("class", "label")
.text(function (d) {
   return d.name;
})
.attr("x", function (d) {
  return d.x;
})
.attr("y", function (d) {
   return d.y;
})
.attr("font-family", "sans-serif")
.attr("font-size", "11px")
.attr("fill", "black")
.on("mouseover", function (d) {
   d3.select(this).attr("fill", "blue");
   d.onFocus();
})
.on("mouseout", function (d) {
   d3.select(this).attr("fill", "black");
   d.onFocusLost();
})
.attr("id", function (d) {
    d.textId = "text" + d.id;
    return"text" + d.id;
});
With this we are done with creating Quadrant Chart. Let us see the output of the code written so far by running
ng serve in the terminal from the project directory, which will serve the application on the lightweight server. Url will be provided in the console.
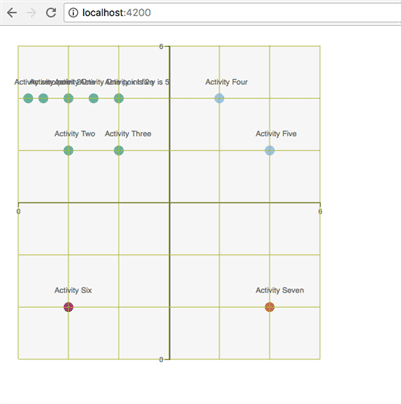
In my case it was http://localhost:4200. This will be same unless 4200 port is occupied or you change the port of ng serve command.
Chart looked like below
 Using d3-force module to avoid overlapping of labels in the above chart
As we discussed d3-force module has got forceSimulation API, which simulates the forces to change the position of the nodes.
There are multiple forces available to simulate in this module.
- Centering :- The centring force translates nodes uniformly so that the mean position of all nodes (the centre of mass if all nodes have equal weight) is at the given position <x,y>
- Collision :- The collision force treats nodes as circles with a given radius, rather than points, and prevents nodes from overlapping.
- Links :- The link force pushes linked nodes together or apart according to the desired link distance .
- Many-Body :- The many-body (or n-body) force applies mutually amongst all nodes. It can be used to simulate gravity (attraction) if the strength is positive, or electrostatic charge (repulsion) if the strength is negative.
- Positioning :- The x– and y-positioning forces push nodes towards a desired position along the given dimension with a configurable strength.
From all these forces May-Body is suitable to full fill our need. So I have created attraction Force and repulsion Force objects with this force. Negative strength makes the force as repulsive and positive strength makes the force as attractive.
Create attract, repel forces and simulate the forces
forceSimulation simulates the nodes in the label_array but not the actual elements, the tick is the event which will be fired on each simulation timer. In this event handler set the x and y position values in a simulated node to the actual label elements.
function ticked() {
   labels.attr("x", function (d) { returnd.x; })
         .attr("y", function (d) { return d.y; });
}
var repelForce = d3.forceManyBody().strength(-140).distanceMax(80).distanceMin(20);
var attractForce = d3.forceManyBody().strength(100).distanceMax(100).distanceMin(100);
var simulation = d3.forceSimulation(label_array)
                          .alphaDecay(0.15)
                          .force("attractForce", attractForce)
                          .force("repelForce", repelForce)
                          .on("tick", ticked);
Strength, distanceMax and distanceMin are variables we have to choose the best ones which fits our solution.
After using forceSimulation Chart looks like below
With the above changes, Labels are not overlapping but the labels are scattered. It is hard to figure out which label belongs to which node. Let us try to draw lines linking the circle(node) and the label.
To do this we have to Create anchor_array while creating the label_array and append anchors similar to the labels.
var links = svg.selectAll(".link")
.data(anchor_array)
.enter()
.append("line")
.attr("class", "link")
.attr("x1", function (d) { return (d.x); })
.attr("y1", function (d) { return (d.y); })
.attr("x2", function (d) { return (d.cx + 27); })
.attr("y2", function (d) { return (d.cy + 27); })
.attr("stroke-width", 0.6)
.attr("stroke", "gray")
.attr("id", function (d) {
     d.textId = "text" + d.id;
     d.lineId = "line" + d.id;
     return"line" + d.id;
});
We have to arrange the links according to the labels arranged after simulation, For that, we have to listen for end event on simulation and then arrange the position of the anchor/link elements created in the previous step.
function simulationEnd() {
   links.attr("x1", function (d) {
         letbbox = (document.getElementById(d.textId) asany).getBBox();
         return bbox.x + (bbox.width / 2);
   })
   .attr("y1", function (d) {
           letbbox = (document.getElementById(d.textId) asany).getBBox();
            return bbox.y + bbox.height;
   });

}

varrepelForce = d3.forceManyBody().strength(-140).distanceMax(80).distanceMin(20);
varattractForce = d3.forceManyBody().strength(100).distanceMax(100).distanceMin(100);
varsimulation = d3.forceSimulation(label_array)
                  .alphaDecay(0.15)
                  .force("attractForce", attractForce)
                  .force("repelForce", repelForce)
                  .on("tick", ticked)
                  .on("end", simulationEnd);
Now the chart looks like
Summary
In this article, we have learnt how to build D3 Quadrant Chart in Angular2 application. Further, we learned about how to avoid labels overlap in the chart using d3-force. We also discussed how to import the D3 library into the Angular2 application.
You can find the sample application code we have done here in GitRepository.


I believe this is one of the most vital information for me. And i am glad studying your article. However wanna observation on few basic things, The site taste is perfect, the articles is actually nice : D. Just right task, cheers
Hi there just wanted to give you a brief heads up and let you know a few of the pictures aren’t loading properly. I’m not sure why but I think its a linking issue. I’ve tried it in two different browsers and both show the same outcome.
Hi there, just became alert to your blog through Google, and found that it’s really informative. I am going to watch out for brussels. I will be grateful if you continue this in future. Lots of people will be benefited from your writing. Cheers!
It’s an remarkable piece of writing for all the online viewers; they will obtain benefit from it I am sure.
I like the valuable information you supply to your articles. I will bookmark your blog and take a look at once more right here regularly. I am quite sure I will be told plenty of new stuff right here! Best of luck for the following!
Thanks to my father who shared with me on the topic of this webpage, this blog is truly remarkable.