


Blogs
Logs Monitoring in Microservices using ELK
In the earlier blog, we discussed Getting started with Microservices with spring boot framework. As part of that, you learned:
- How to get started with Microservices
- Logging
- Auditing
- Transaction Management
- Unit Testing
- Sample application with above details
Logs management plays a vital role when we encounter an error in the application. If we do not manage the logs, it will be difficult in any application, especially in microservices architecture to find the error and fix it. However, we do need to understand how to monitor & manage the logs.
In this article, we will learn the following:
- What to expect from the Log Monitoring & Managing?
- Technologies used
- Sample applications
Have a glance at our previous blog, to get the basic details about ELK stack.
Prerequisites
We need the following software on our system to implement a microservices & managing their logs:
- Java (Minimum version 1.7)
- Maven
- Eclipse IDE for Java EE Developers
- Elasticsearch
- Logstash
- Kibana
Getting ready
- Download and install Java in your system. Follow the steps as per your OS.
- Setup maven as per the steps mentioned here.
- Install Eclipse using the steps, as per the Eclipse version and your OS.
- Configure Elasticsearch
What to expect from this article?
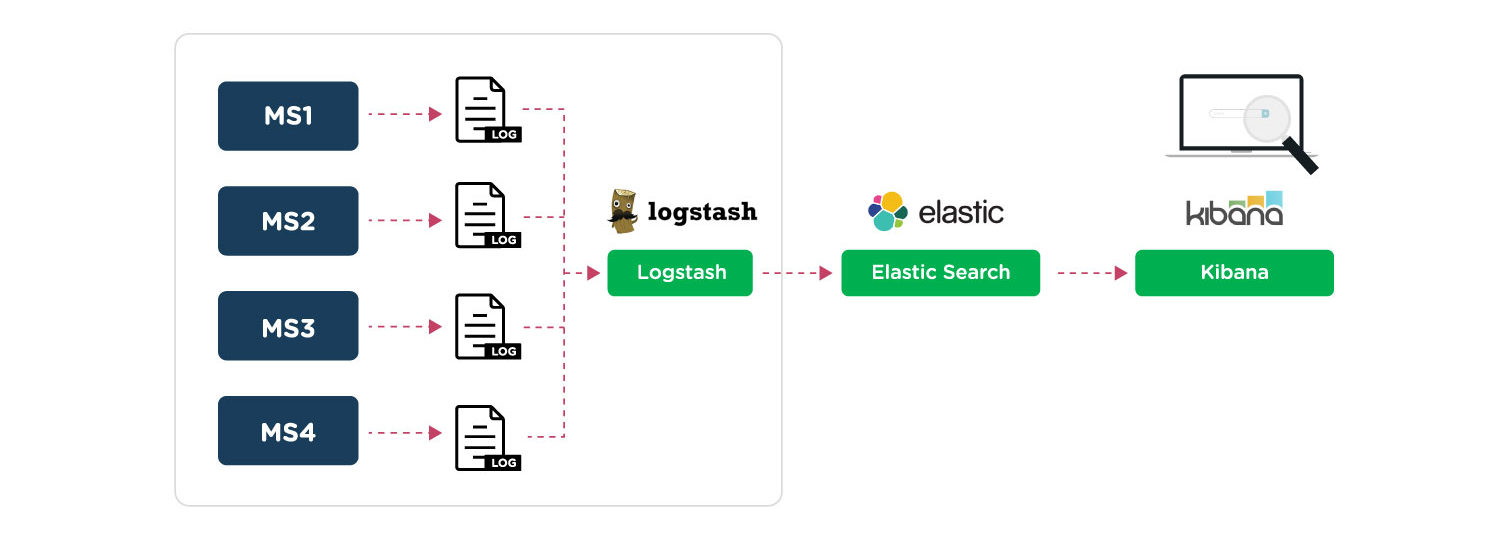 Microservices logs managing using ELK architecture
- Two sample microservices applications having inter microservices communication.
- We will push all microservices logs to one elasticsearch cluster using logstash.
- We will analyze the logs using Kibana. Whenever we get some error in the application(s), we can get the error details and analyze them in a simple way.
Sample applications
Here I am going to discuss the Patient application, which is discussed earlier in Getting Started with Microservices blog and the Doctor application. Along with these applications, implemented a util application and it can be used in both the microservices for common utilities.
Patient Microservice details:
This microservice is used to provide the required operations for the patient.
We have below APIs available in our application:
- /patient/create – Create a patient record
- /patient/disable – Disable patient record
- /patient/enable – Enable patient record
- /patient/update – Update patient record
- /patient/{id} – Get patient record by id
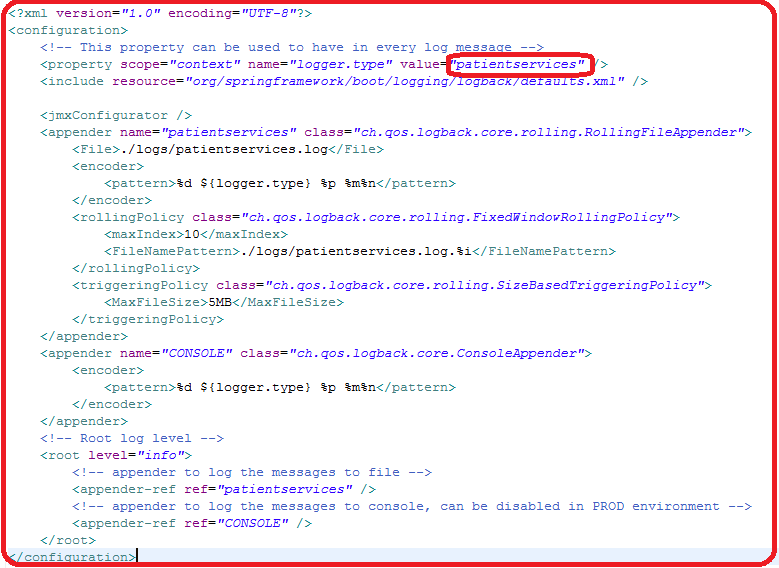
We will use logback.xml to have the logging configuration and the details are shown below:
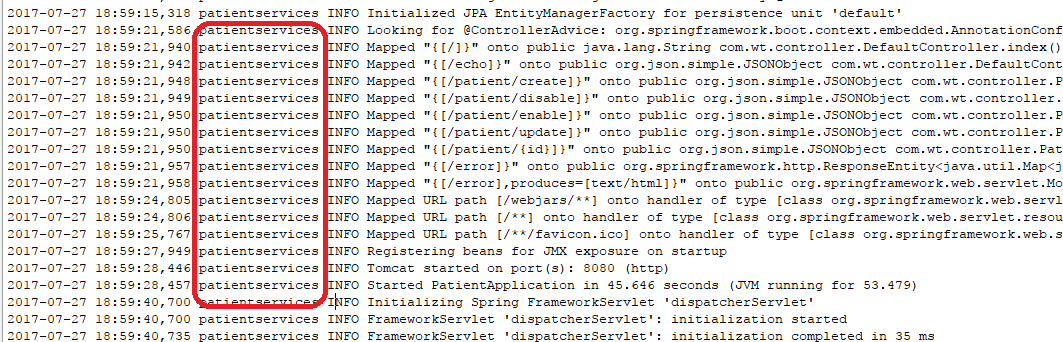
Start the application using com.wt.PatientApplication from the eclipse or java -jar patient-2.0.jar from command prompt/terminal and you can confirm that the application started by looking at the logs as shown below:
Doctor Microservice details:
This microservice is used to provide the required operations for the doctors. A doctor can see the patient details along with patient’s consulting details. We have implemented an API in this microservice to get the patient details and add to doctor details.
We have below APIs available in our application:
- /doctor/create – Create doctor record
- /doctor/disable – Disable doctor record
- /doctor/enable – Enable doctor record
- /doctor/update – Update doctor record
- /doctor/{id} – Get doctor record by id
- /doctor/doctorPatient – Get doctor and patient records by ids
We have inter microservice communication in the above case. We need to log the required data in case of any error. Then, it will be easy to analyze.
logback.xml file configurations are shown below with the details:
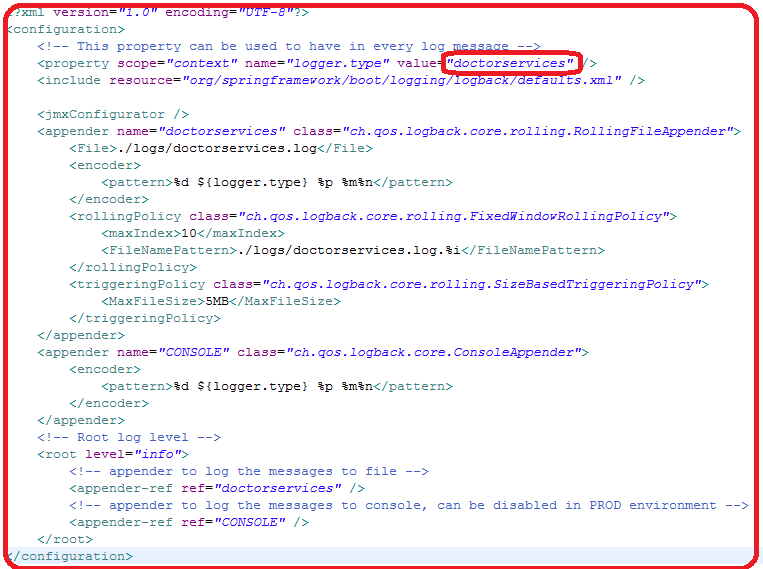
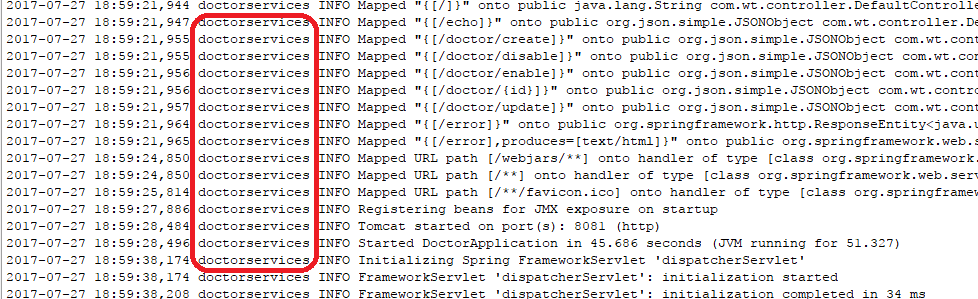
Start the application using com.wt.DoctorApplication from eclipse or java -jar doctor-1.0.jar from the command prompt/terminal and you can confirm if the application has started by looking at the logs as below:
Elasticsearch:
ElasticSearch is a Search Server having capabilities of providing real-time data and analytics. It helps in improving data analytics by performing any search operation. Start Elasticsearch to enable the Logstash to push the logs data.
Logstash:
Logstash is a data pipeline which provides a centralized area where logs and data from a variety of systems are stored and are monitored if any further subsequent actions are required.
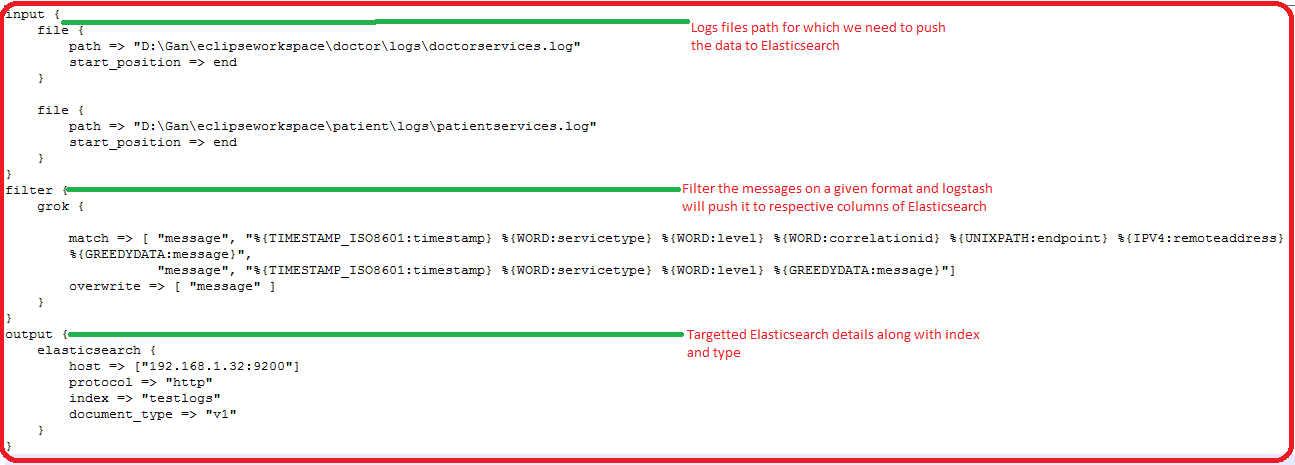
Configure Logstash to push the logs to Elasticsearch as shown below:
Kibana:
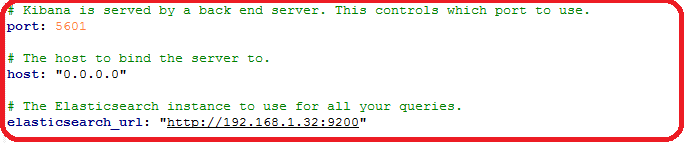
Kibana, a powerful and intelligent tool that gives a streamlined shape to any kind of structured and unstructured data. It easily visualizes data stored in Elasticsearch and gives a better understanding by slicing down large volumes of data. Configure Kibana to pull the data from Elasticsearch
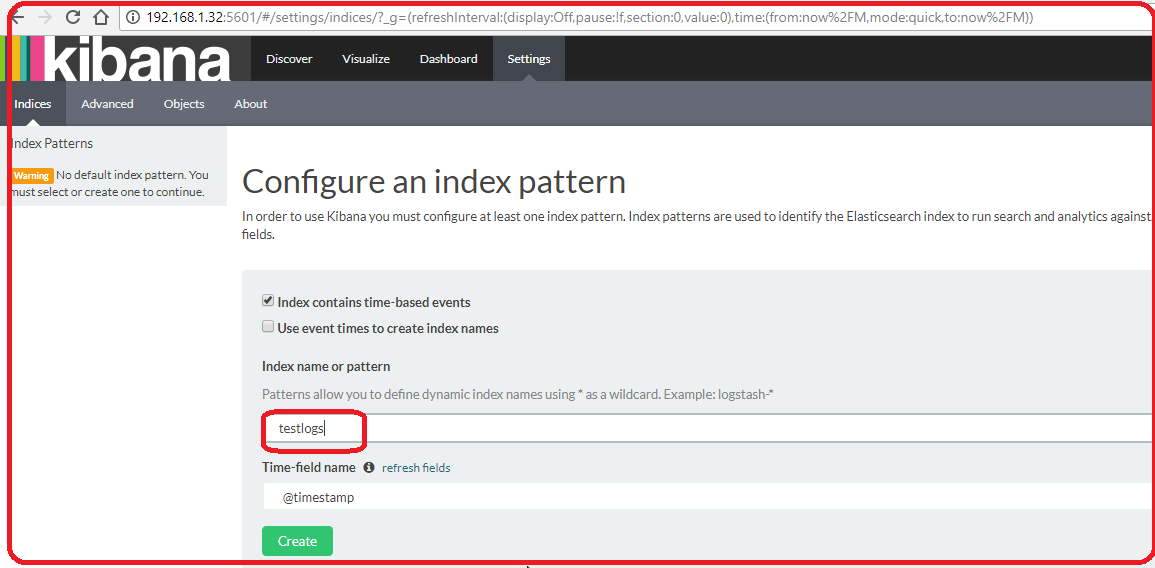
Start the Kibana and configure the logs index to analyze the data:
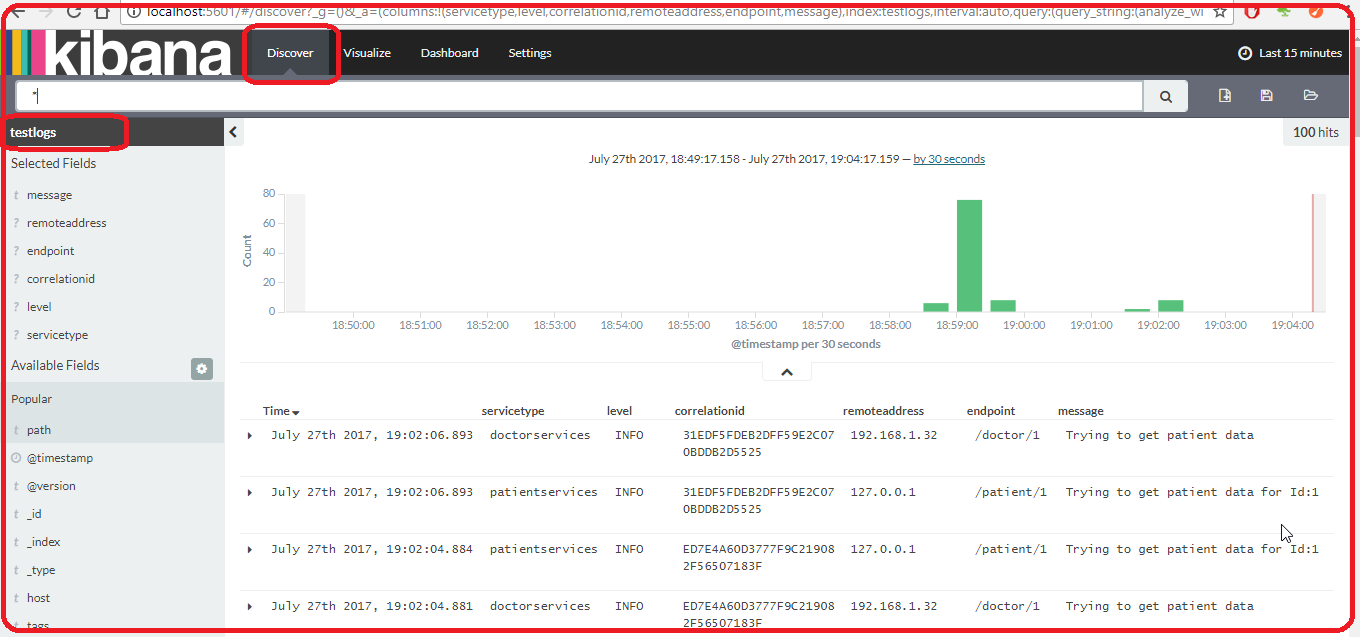
Check the logs data in Kibana:
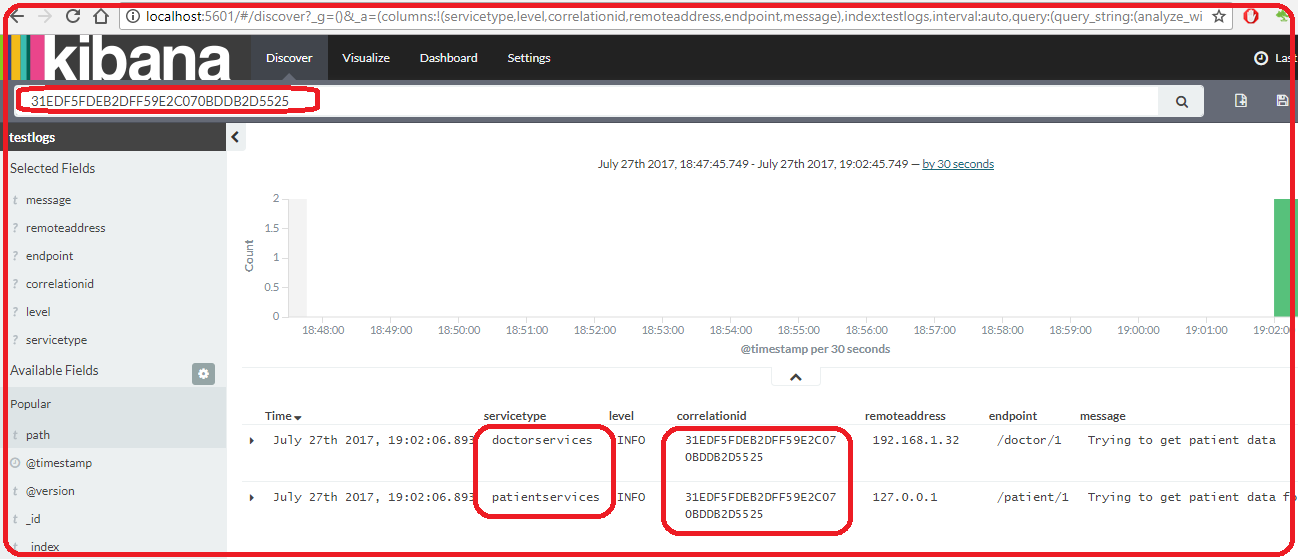
Quite often we may have a need, where a transaction would involve the use of more than one Microservices. In such cases, it becomes important to ensure that we are able to look into the related logs. Filter the related error messages based on the correlationId to have a better analysis. We can have a separate application to check the specific error patterns and send an alert to the respective monitoring team.
A sample image is shown below, for the correlationId filter:
Summary
Logging and auditing is the key aspect of any enterprise application. It provides us the vital pieces of information to ensure, we fix any error which occurs or improve the application by reducing the undesired events.
For the applications using the Microservices, we can monitor the logs using ELK (Elasticsearch, Logstash, and Kibana). Further, in this article, we also learned that we can analyze logs details across multiple microservices using correlationId.
I hope this article helps you in setting up your logging and monitoring environment effectively. At Walking Tree, we do believe that Microservices is the way forward architecture. However, it does require you to do few things correctly to be able to make effective use of this architecture. Do connect us for any support on Microservices.


Works perfectly! Thank you very much!
Where I can find source code of this example.