

Blogs
Logs Monitoring Issues – 3 Tools, Logstash, Elasticsearch and Kibana to Fix it!
Problem Statement –
As production environment is getting more distributed and the numbers of servers are continuously increasing, maintaining their performance by continuously monitoring them through logs can be a big tedious job. The main problem comes into the picture because these log files are scattered across different locations on multiple virtual or physical servers and are required to be monitored in near real-time environment.
Introduction –
The motive of this article is to provide the best method for handling huge amount of logs on multiple servers in distributed environment and get insights required to manage them in more efficient manner. The step by step process will guide you – how to avoid opening large amount of log files on different servers to make your life easy with Logs Monitoring. Further it also imparts know how to identify the errors and root issues in the Log files.
Pre – Requisites –
The following tools are require to manage the logs monitoring problem –
a) Logstash-1.5.0 –
Logstash is a data pipeline which provides a centralized area where logs and data from variety of systems are stored, and are monitored if any further subsequent actions are required.
b) ElasticSearch-1.5.2 –
ElasticSearch is a Search Server having capabilities of providing real time data and analytics. It helps in improving data analytics by performing any search operation and is used by Logstash to store incoming parsed logs.
c) Kibana-4.0.1 –
Kibana, a powerful and intelligent tool that gives a streamlined shape to any kind of structured and unstructured data. It easily visualizes data stored in Elasticsearch and gives a better understanding by slicing down large volumes of data.
Getting started:
- ElasticSearch
- Start elasticsearch
- Log stash
- Configuration to track the server log file
- Configuration to filter on log level basis
- Configuration to push those logs to elasticsearch
- Kibana
- Configuration to connect with Elasticsearch
- Give shape for those logs data
Detail:
Step 1: Download Elasticsearch-1.5.2 from https://download.elastic.co/elasticsearch/elasticsearch/elasticsearch-1.5.2.zip and extract the zip file, move to elasticsearch-1.5.2/bin/ and starts with ./elasticsearch
Step 2: Download logstash-1.5.0 from https://download.elastic.co/logstash/logstash/logstash-1.5.0.zip and extract the zip file, move to logstash-1.5.0/bin/
- Create indexer.conf – configuration file for track the logs and push to elasticsearch
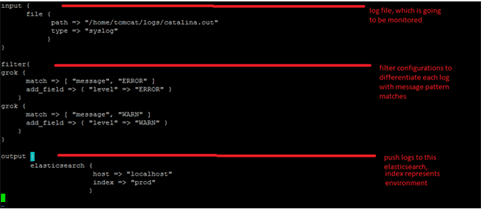
- Starts with ./logstash agent –f indexer.conf
- While printing logs into /home/tomcat/logs/catalina.out, logstash catches every log and pushes to elasticsearch
Note: You can repeat this same step with multiple servers log file.
Step 3: Download kibana-4.0.1 from https://download.elasticsearch.org/kibana/kibana/kibana-4.0.1-linux-x64.tar.gz and extract file.
- Modify host to localhost on config/kibana.yml ( host : “localhost” )
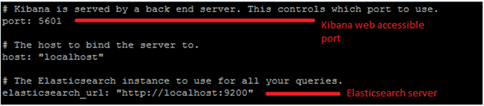
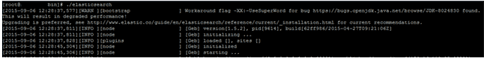
- Starts with bin/kibana
![]()
- Access kibana with http://localhost:5601/ and add index to search the logs
- Select Discover to search the corresponding index logs
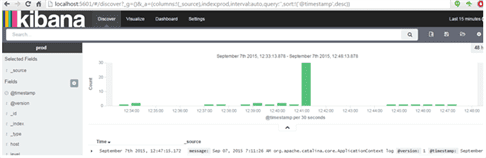
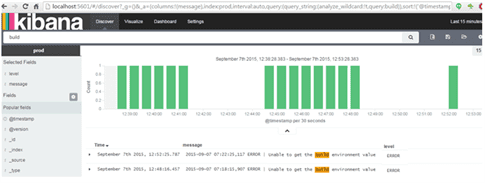
- Search with log message ( below search with build ) and add selected fields to show only required fields
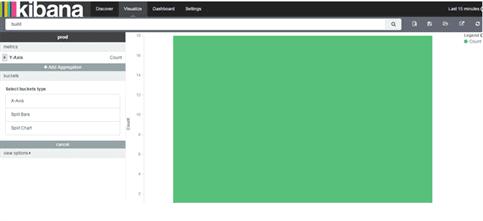
- Kibana shows the logs with multiple shapes, clicks on Visualize and select one of the shapes or can create customized shape.

Selected Vertical bar chart and searched with log message
Summary –
In this article, we explained how to deal with huge amount of log files by using 3 simple tools – “Logstash, Elasticsearch and Kibana”. With the introduction of these tools (updated version) it became very easy to manage the logs as compared to previous one.
Hope this article was informative and leaves you with a better understanding of what logs are and how to manage them!
Liked this Article, Want to know more about us? Get in touch with us through our website Walking Tree and know the latest updates and happenings in the IT industry.