

Blogs
Log management of Microservices in AWS using ELK

In my previous blog, we discussed the ‘Log management of Microservices using ELK’ in data center kind of environment. However, we are all aware of the fact that Microservices full potential will be effectively realized only in a cloud-based environment. So it is important to know and master the log management of Microservices in the cloud environment. In this blog, I will be covering steps to configure effective log management using ELK in AWS environment.
As part of this article, I will be covering the following details:
- How to configure Logstash for EC2 instance
- How to push the logs to Elasticsearch using logstash
- How to analyze the logs using Kibana
Prerequisites
We need the following software to configure and manage the logs. Here the assumption is you already have Microservices environment up and running.
-
- AWS EC2 container
- AWS Elasticsearch Service
- Kibana
- Logstash
- Docker
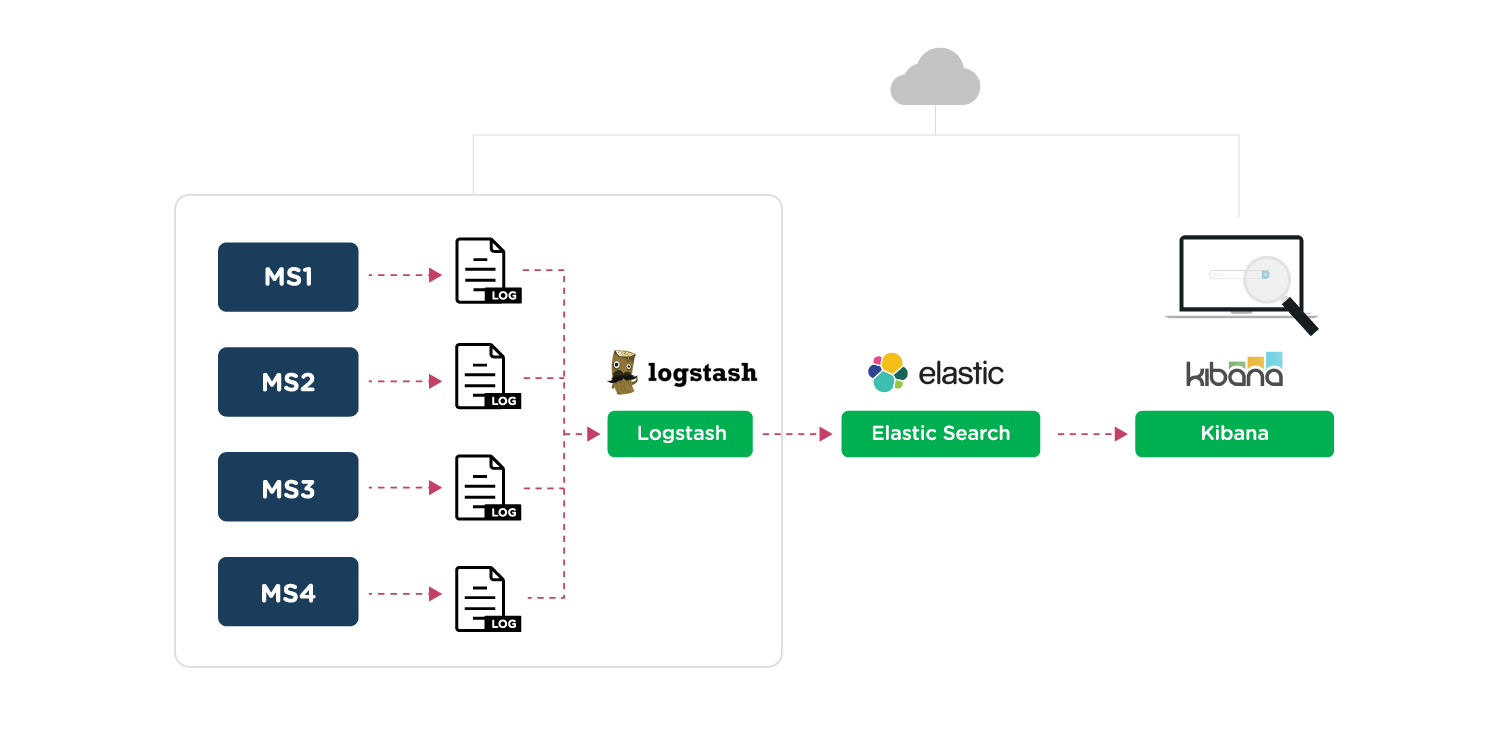
Block Diagram
Configuration
We can divide the configuration into the following high-level steps. I will be detailing each step further below:
- Configure the log directory
- Create a logstash docker image
- Define a task to use the logstash image
- Create a daemon service
Configure the log directory
- Update the logback.xml file to keep a common path for logs as shown below
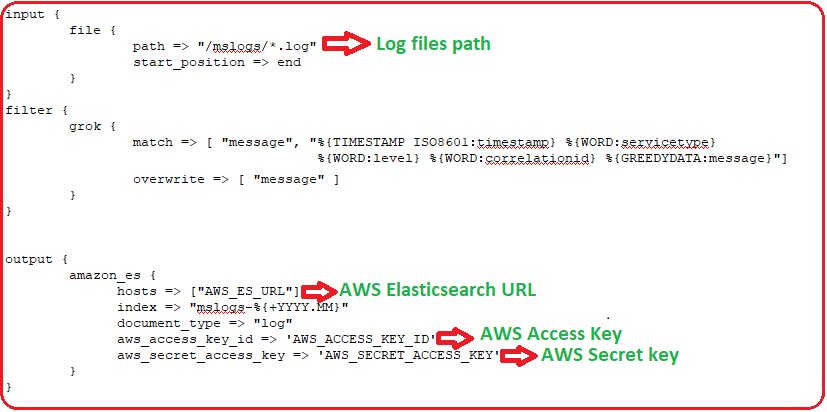
- Create a logstash config file to customize the input & output sources in logstash
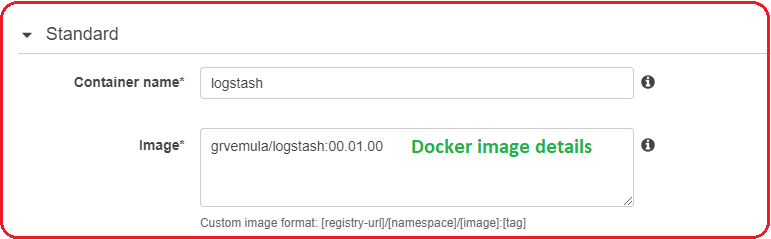
Create a logstash docker image
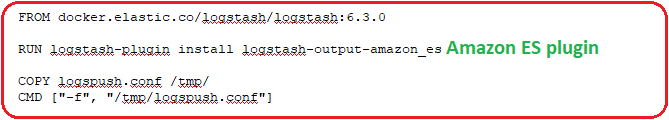
- Create a Dockerfile to create a logstash image with AWS plugin (amazon_es)
- Create the logstash docker image
- docker build -t grvemula/logstash:00.01.00 .
- Push it to your private docker hub or public as per your need
- docker push grvemula/logstash:00.01.00
Define a task to use the logstash image
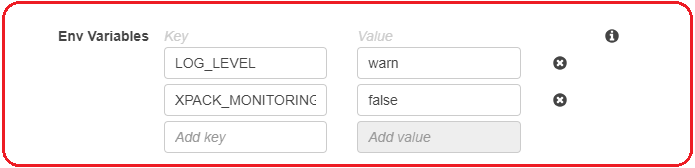
- Create a task definition in AWS to use logstash docker image and required parameters as shown below:
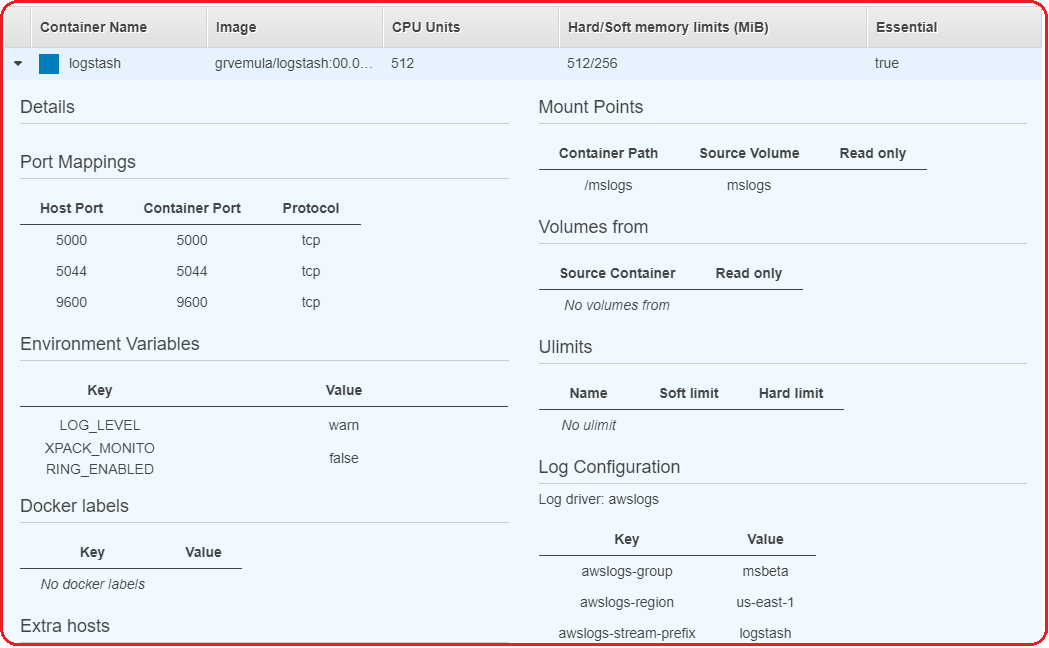
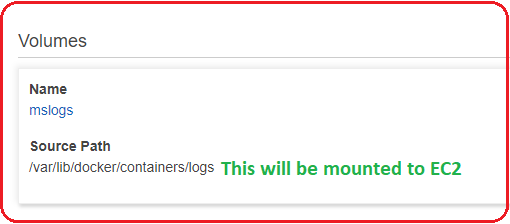
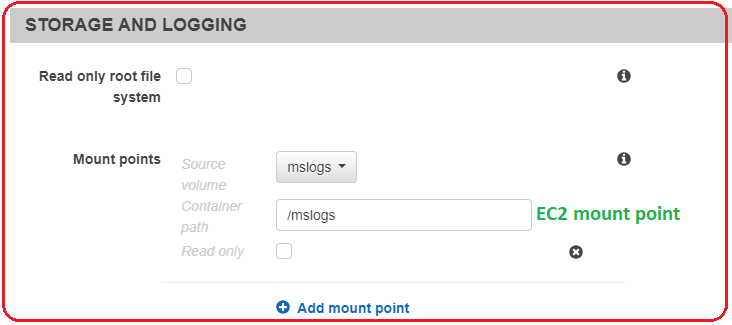
- Add volumes to the logstash Task definition and to all microservices tasks. These will use the same volume and push/pull the logs.
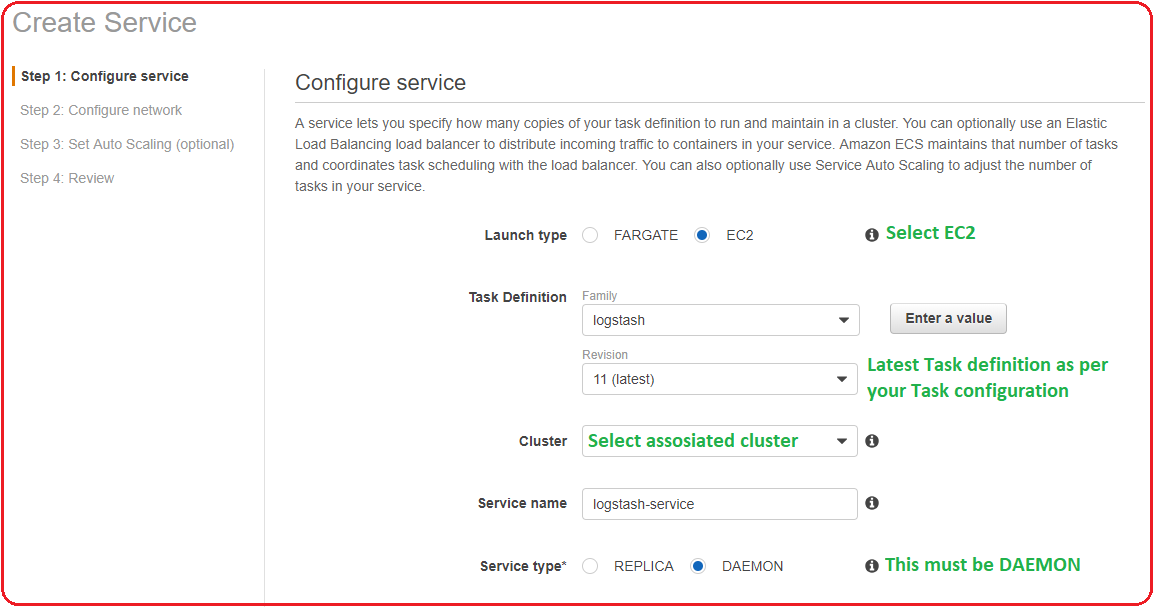
Create a daemon service
- Create a daemon service to use the task definition and start the logstash. The daemon logstash in the EC2 will take care to push the log files available in the directory, which are available in the directory on the EC2.
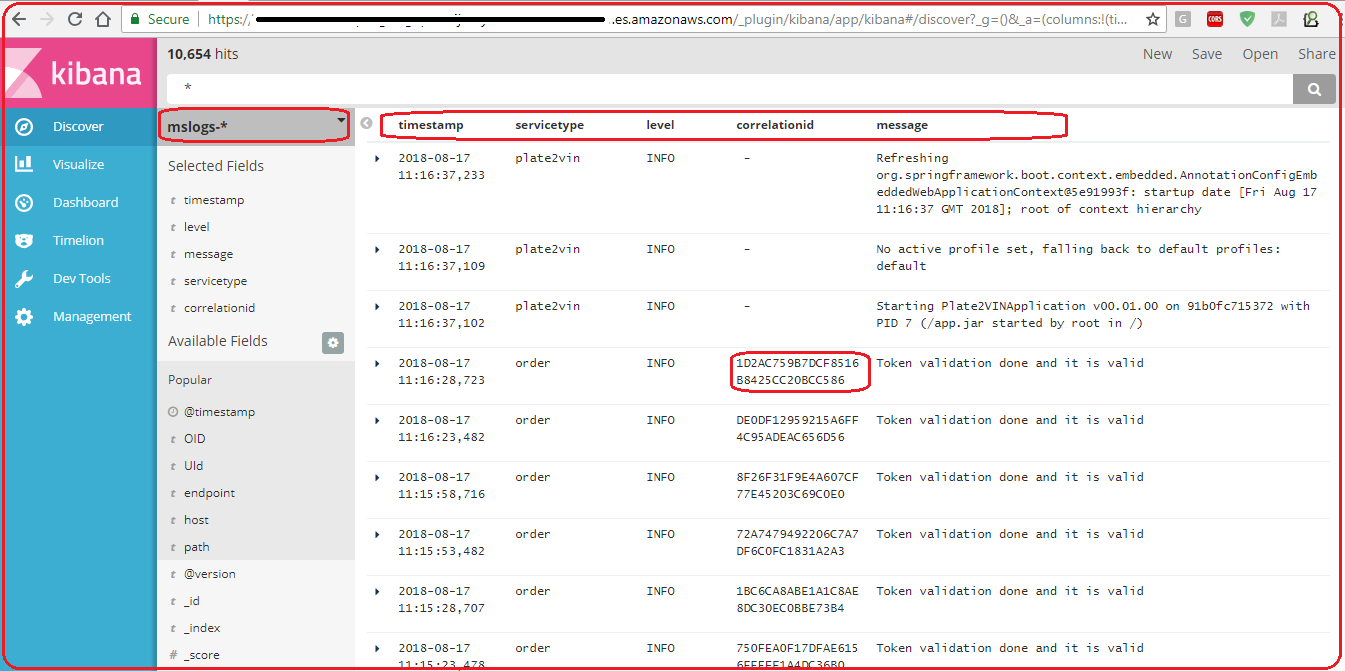
Output
- You can see the log output in Kibana. All the logs from different Microservice instances are pushed appearing in a single place.
Summary
Logging and auditing are the key aspects of any enterprise application. They provide us with the vital information to quickly isolate the problem which in turn help us to quickly restore the failed application. With the above configuration, we can watch all the logs from a single place which alleviates the pain of navigating to multiple places to see logs.
I hope this article helps you in setting up your logging and monitoring environment effectively. At Walking Tree, we do believe that Microservices is the way forward architecture. However, it does require you to do a few things correctly to be able to make effective use of this architecture. Do connect us for any support on Microservices.