Blogs
Google Sheets for Repeat Grid


The biggest challenge for any UX Designer who is working on prototyping is to design a grid which resembles live data. E.g: To mock adding a data row into the grid or to display sorting behaviour on to the screen, designers have to type in the data manually which is a real pain.
This is where “Google Sheets” plugin works really well, enabling designers to load google sheets data into repeat grid. Here is how it works.
- Install “Google Sheets” Plugin
- Create a repeat grid on your Artboard
- Create a google sheet, with the data needed for the grid to display. The first row of the sheet should represent the mapping column name.
E.g.: If the repeat grid column in Adobe XD is supposed to display “First Name, in google sheets, name the first row as “fName” or “First Name” which makes it easy to map for the columns - Make the google sheets accessible to the XD app, by choosing the appropriate sharing options

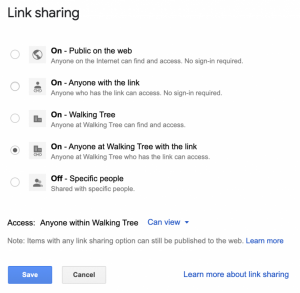
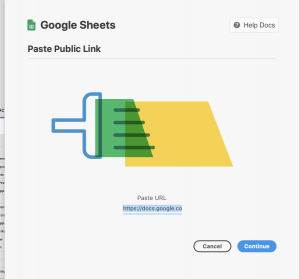
- Make the google sheets accessible to the XD app, by choosing the appropriate sharing options

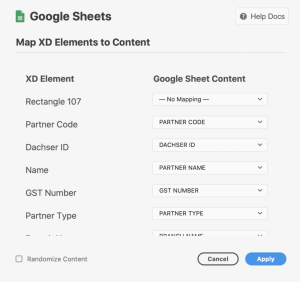
- In this step, carefully map the element with the appropriate column name. This is where naming the elements in Adobe XD with appropriate labels will come very handy. If you use the same naming convention while creating the elements on Adobe XD and Google Spreadsheet, it will make life easier.
Once the mapping is done, click on “Apply” and you are done. - Now if we have to change the data on the grid, all we have to do is, go into the spreadsheet, change the needed data, come back to Adobe XD, select “Google Sheets” plugin and refresh data.

- Similarly if we have to use a CSV file, follow Step 5 and Step 6 and the grid is ready for you


